
 Yahoo Finance
 Don't Sell Gulf Keystone Petroleum Limited (LON:GKP) Before You Read This

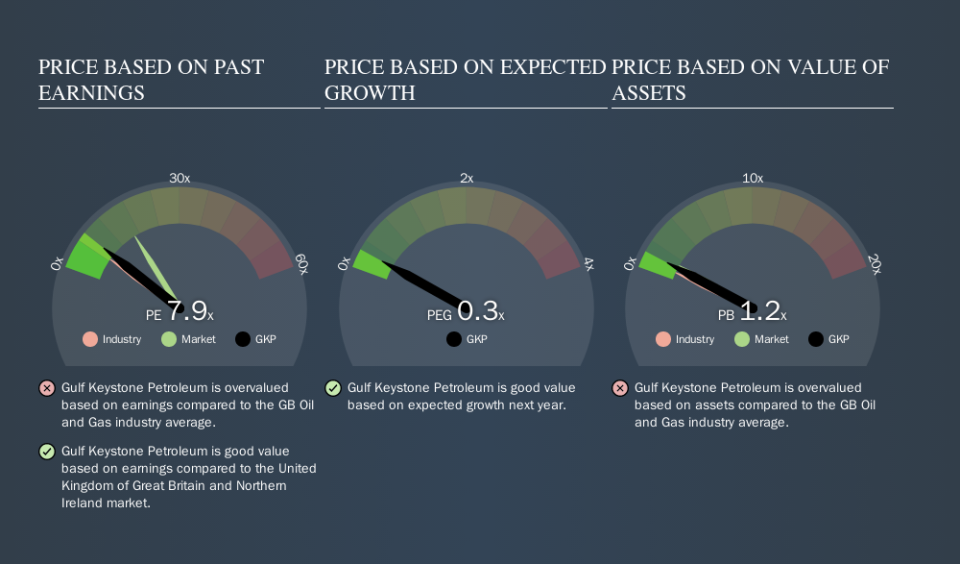
The goal of this article is to teach you how to use price to earnings ratios (P/E ratios). We'll look at Gulf Keystone Petroleum Limited's (LON:GKP) P/E ratio and reflect on what it tells us about the company's share price. Looking at earnings over the last twelve months, Gulf Keystone Petroleum has a P/E ratio of 7.93. In other words, at today's prices, investors are paying £7.93 for every £1 in prior year profit.
See our latest analysis for Gulf Keystone Petroleum
How Do I Calculate A Price To Earnings Ratio?
The formula for P/E is:
Price to Earnings Ratio = Share Price (in reporting currency) ÷ Earnings per Share (EPS)
Or for Gulf Keystone Petroleum:
P/E of 7.93 = £2.68 (Note: this is the share price in the reporting currency, namely, USD ) ÷ £0.34 (Based on the trailing twelve months to June 2019.)
Is A High Price-to-Earnings Ratio Good?
The higher the P/E ratio, the higher the price tag of a business, relative to its trailing earnings. That isn't necessarily good or bad, but a high P/E implies relatively high expectations of what a company can achieve in the future.
How Does Gulf Keystone Petroleum's P/E Ratio Compare To Its Peers?
One good way to get a quick read on what market participants expect of a company is to look at its P/E ratio. As you can see below, Gulf Keystone Petroleum has a higher P/E than the average company (6.6) in the oil and gas industry.
Its relatively high P/E ratio indicates that Gulf Keystone Petroleum shareholders think it will perform better than other companies in its industry classification. Clearly the market expects growth, but it isn't guaranteed. So investors should delve deeper. I like to check if company insiders have been buying or selling.
How Growth Rates Impact P/E Ratios
P/E ratios primarily reflect market expectations around earnings growth rates. Earnings growth means that in the future the 'E' will be higher. That means even if the current P/E is high, it will reduce over time if the share price stays flat. And as that P/E ratio drops, the company will look cheap, unless its share price increases.
Gulf Keystone Petroleum's earnings made like a rocket, taking off 93% last year.
Don't Forget: The P/E Does Not Account For Debt or Bank Deposits
The 'Price' in P/E reflects the market capitalization of the company. That means it doesn't take debt or cash into account. Theoretically, a business can improve its earnings (and produce a lower P/E in the future) by investing in growth. That means taking on debt (or spending its cash).
Such expenditure might be good or bad, in the long term, but the point here is that the balance sheet is not reflected by this ratio.
How Does Gulf Keystone Petroleum's Debt Impact Its P/E Ratio?
Gulf Keystone Petroleum has net cash of US$205m. This is fairly high at 33% of its market capitalization. That might mean balance sheet strength is important to the business, but should also help push the P/E a bit higher than it would otherwise be.
The Verdict On Gulf Keystone Petroleum's P/E Ratio
Gulf Keystone Petroleum's P/E is 7.9 which is below average (16.4) in the GB market. The net cash position gives plenty of options to the business, and the recent improvement in EPS is good to see. The relatively low P/E ratio implies the market is pessimistic.
Investors have an opportunity when market expectations about a stock are wrong. If the reality for a company is not as bad as the P/E ratio indicates, then the share price should increase as the market realizes this. So this free visualization of the analyst consensus on future earnings could help you make the right decision about whether to buy, sell, or hold.
Of course, you might find a fantastic investment by looking at a few good candidates. So take a peek at this free list of companies with modest (or no) debt, trading on a P/E below 20.
We aim to bring you long-term focused research analysis driven by fundamental data. Note that our analysis may not factor in the latest price-sensitive company announcements or qualitative material.
If you spot an error that warrants correction, please contact the editor at editorial-team@simplywallst.com. This article by Simply Wall St is general in nature. It does not constitute a recommendation to buy or sell any stock, and does not take account of your objectives, or your financial situation. Simply Wall St has no position in the stocks mentioned. Thank you for reading.
