
 Yahoo Finance
 Don't Sell Plus500 Ltd. (LON:PLUS) Before You Read This

The goal of this article is to teach you how to use price to earnings ratios (P/E ratios). We'll look at Plus500 Ltd.'s (LON:PLUS) P/E ratio and reflect on what it tells us about the company's share price. Plus500 has a price to earnings ratio of 6.59, based on the last twelve months. In other words, at today's prices, investors are paying £6.59 for every £1 in prior year profit.
View our latest analysis for Plus500
How Do You Calculate A P/E Ratio?
The formula for price to earnings is:
Price to Earnings Ratio = Price per Share (in the reporting currency) ÷ Earnings per Share (EPS)
Or for Plus500:
P/E of 6.59 = £9.80 (Note: this is the share price in the reporting currency, namely, USD ) ÷ £1.49 (Based on the year to June 2019.)
Is A High P/E Ratio Good?
A higher P/E ratio means that buyers have to pay a higher price for each £1 the company has earned over the last year. That isn't necessarily good or bad, but a high P/E implies relatively high expectations of what a company can achieve in the future.
How Does Plus500's P/E Ratio Compare To Its Peers?
The P/E ratio essentially measures market expectations of a company. You can see in the image below that the average P/E (6.6) for companies in the diversified financial industry is roughly the same as Plus500's P/E.
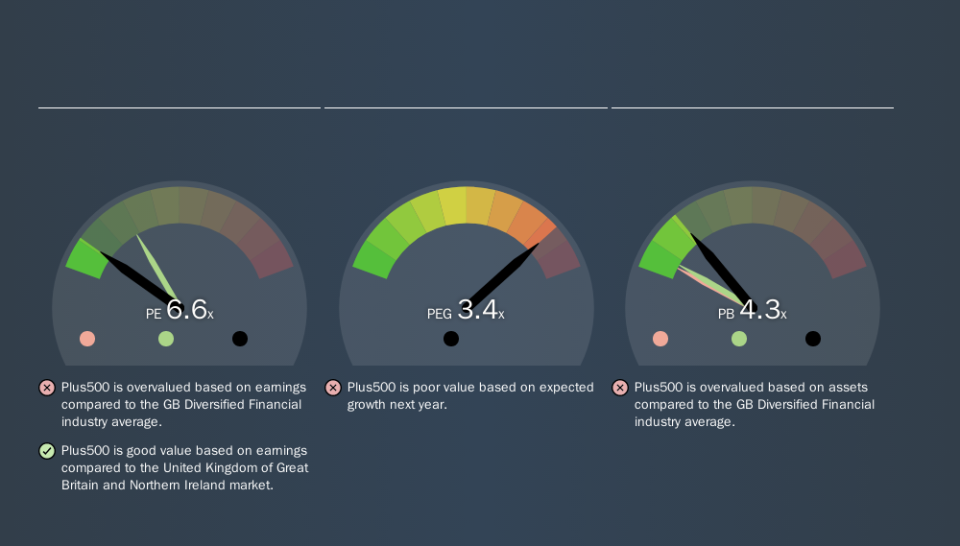
Its P/E ratio suggests that Plus500 shareholders think that in the future it will perform about the same as other companies in its industry classification. If the company has better than average prospects, then the market might be underestimating it. Further research into factors such as insider buying and selling, could help you form your own view on whether that is likely.
How Growth Rates Impact P/E Ratios
Earnings growth rates have a big influence on P/E ratios. Earnings growth means that in the future the 'E' will be higher. That means even if the current P/E is high, it will reduce over time if the share price stays flat. Then, a lower P/E should attract more buyers, pushing the share price up.
Plus500's earnings per share fell by 54% in the last twelve months. But it has grown its earnings per share by 14% per year over the last five years.
Remember: P/E Ratios Don't Consider The Balance Sheet
It's important to note that the P/E ratio considers the market capitalization, not the enterprise value. So it won't reflect the advantage of cash, or disadvantage of debt. The exact same company would hypothetically deserve a higher P/E ratio if it had a strong balance sheet, than if it had a weak one with lots of debt, because a cashed up company can spend on growth.
Such expenditure might be good or bad, in the long term, but the point here is that the balance sheet is not reflected by this ratio.
Is Debt Impacting Plus500's P/E?
With net cash of US$327m, Plus500 has a very strong balance sheet, which may be important for its business. Having said that, at 30% of its market capitalization the cash hoard would contribute towards a higher P/E ratio.
The Bottom Line On Plus500's P/E Ratio
Plus500 trades on a P/E ratio of 6.6, which is below the GB market average of 17.2. The recent drop in earnings per share would make investors cautious, the relatively strong balance sheet will allow the company time to invest in growth. If it achieves that, then there's real potential that the low P/E could eventually indicate undervaluation.
Investors should be looking to buy stocks that the market is wrong about. As value investor Benjamin Graham famously said, 'In the short run, the market is a voting machine but in the long run, it is a weighing machine. So this free visualization of the analyst consensus on future earnings could help you make the right decision about whether to buy, sell, or hold.
Of course you might be able to find a better stock than Plus500. So you may wish to see this free collection of other companies that have grown earnings strongly.
If you spot an error that warrants correction, please contact the editor at editorial-team@simplywallst.com. This article by Simply Wall St is general in nature. It does not constitute a recommendation to buy or sell any stock, and does not take account of your objectives, or your financial situation. Simply Wall St has no position in the stocks mentioned.
We aim to bring you long-term focused research analysis driven by fundamental data. Note that our analysis may not factor in the latest price-sensitive company announcements or qualitative material. Thank you for reading.
