
 Yahoo Finance
 Don't Sell Renishaw plc (LON:RSW) Before You Read This

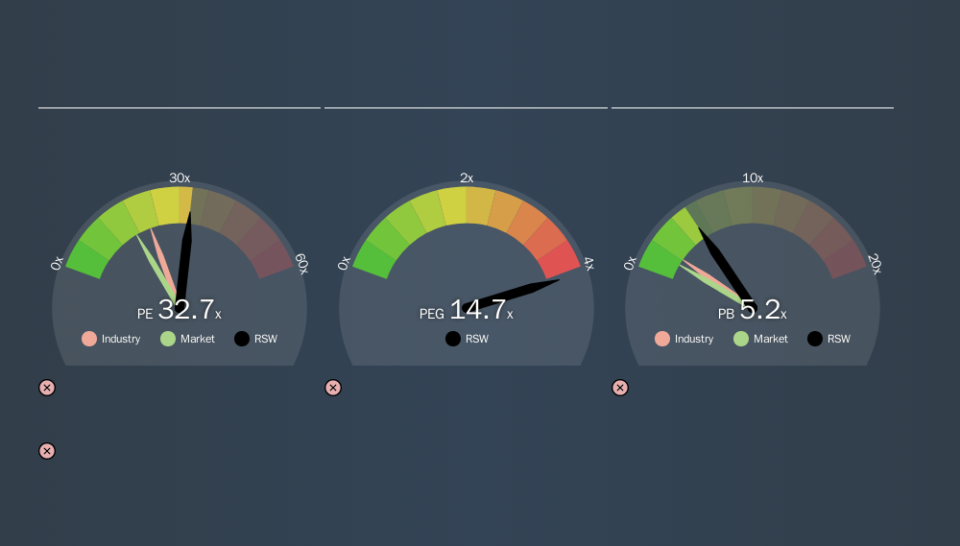
The goal of this article is to teach you how to use price to earnings ratios (P/E ratios). We'll look at Renishaw plc's (LON:RSW) P/E ratio and reflect on what it tells us about the company's share price. What is Renishaw's P/E ratio? Well, based on the last twelve months it is 32.70. That means that at current prices, buyers pay £32.70 for every £1 in trailing yearly profits.
See our latest analysis for Renishaw
How Do You Calculate A P/E Ratio?
The formula for price to earnings is:
Price to Earnings Ratio = Price per Share ÷ Earnings per Share (EPS)
Or for Renishaw:
P/E of 32.70 = £41.44 ÷ £1.27 (Based on the trailing twelve months to June 2019.)
Is A High Price-to-Earnings Ratio Good?
A higher P/E ratio means that investors are paying a higher price for each £1 of company earnings. All else being equal, it's better to pay a low price -- but as Warren Buffett said, 'It's far better to buy a wonderful company at a fair price than a fair company at a wonderful price.
Does Renishaw Have A Relatively High Or Low P/E For Its Industry?
One good way to get a quick read on what market participants expect of a company is to look at its P/E ratio. As you can see below, Renishaw has a higher P/E than the average company (21.8) in the electronic industry.
Renishaw's P/E tells us that market participants think the company will perform better than its industry peers, going forward. Clearly the market expects growth, but it isn't guaranteed. So investors should always consider the P/E ratio alongside other factors, such as whether company directors have been buying shares.
How Growth Rates Impact P/E Ratios
P/E ratios primarily reflect market expectations around earnings growth rates. If earnings are growing quickly, then the 'E' in the equation will increase faster than it would otherwise. That means even if the current P/E is high, it will reduce over time if the share price stays flat. So while a stock may look expensive based on past earnings, it could be cheap based on future earnings.
Renishaw shrunk earnings per share by 30% over the last year. But over the longer term (5 years) earnings per share have increased by 1.4%.
Don't Forget: The P/E Does Not Account For Debt or Bank Deposits
The 'Price' in P/E reflects the market capitalization of the company. Thus, the metric does not reflect cash or debt held by the company. In theory, a company can lower its future P/E ratio by using cash or debt to invest in growth.
While growth expenditure doesn't always pay off, the point is that it is a good option to have; but one that the P/E ratio ignores.
How Does Renishaw's Debt Impact Its P/E Ratio?
Since Renishaw holds net cash of UK£96m, it can spend on growth, justifying a higher P/E ratio than otherwise.
The Verdict On Renishaw's P/E Ratio
Renishaw's P/E is 32.7 which is above average (16.9) in its market. The recent drop in earnings per share would make some investors cautious, but the net cash position means the company has time to improve: and the high P/E suggests the market thinks it will.
Investors have an opportunity when market expectations about a stock are wrong. People often underestimate remarkable growth -- so investors can make money when fast growth is not fully appreciated. So this free visualization of the analyst consensus on future earnings could help you make the right decision about whether to buy, sell, or hold.
You might be able to find a better buy than Renishaw. If you want a selection of possible winners, check out this free list of interesting companies that trade on a P/E below 20 (but have proven they can grow earnings).
We aim to bring you long-term focused research analysis driven by fundamental data. Note that our analysis may not factor in the latest price-sensitive company announcements or qualitative material.
If you spot an error that warrants correction, please contact the editor at editorial-team@simplywallst.com. This article by Simply Wall St is general in nature. It does not constitute a recommendation to buy or sell any stock, and does not take account of your objectives, or your financial situation. Simply Wall St has no position in the stocks mentioned. Thank you for reading.
