
 Yahoo Finance
 Don't Sell Serco Group plc (LON:SRP) Before You Read This

Today, we'll introduce the concept of the P/E ratio for those who are learning about investing. We'll show how you can use Serco Group plc's (LON:SRP) P/E ratio to inform your assessment of the investment opportunity. What is Serco Group's P/E ratio? Well, based on the last twelve months it is 31.01. That corresponds to an earnings yield of approximately 3.2%.
View our latest analysis for Serco Group
How Do I Calculate A Price To Earnings Ratio?
The formula for P/E is:
Price to Earnings Ratio = Price per Share ÷ Earnings per Share (EPS)
Or for Serco Group:
P/E of 31.01 = £1.334 ÷ £0.043 (Based on the year to December 2019.)
(Note: the above calculation results may not be precise due to rounding.)
Is A High Price-to-Earnings Ratio Good?
A higher P/E ratio implies that investors pay a higher price for the earning power of the business. All else being equal, it's better to pay a low price -- but as Warren Buffett said, 'It's far better to buy a wonderful company at a fair price than a fair company at a wonderful price'.
Does Serco Group Have A Relatively High Or Low P/E For Its Industry?
The P/E ratio indicates whether the market has higher or lower expectations of a company. The image below shows that Serco Group has a higher P/E than the average (16.3) P/E for companies in the commercial services industry.
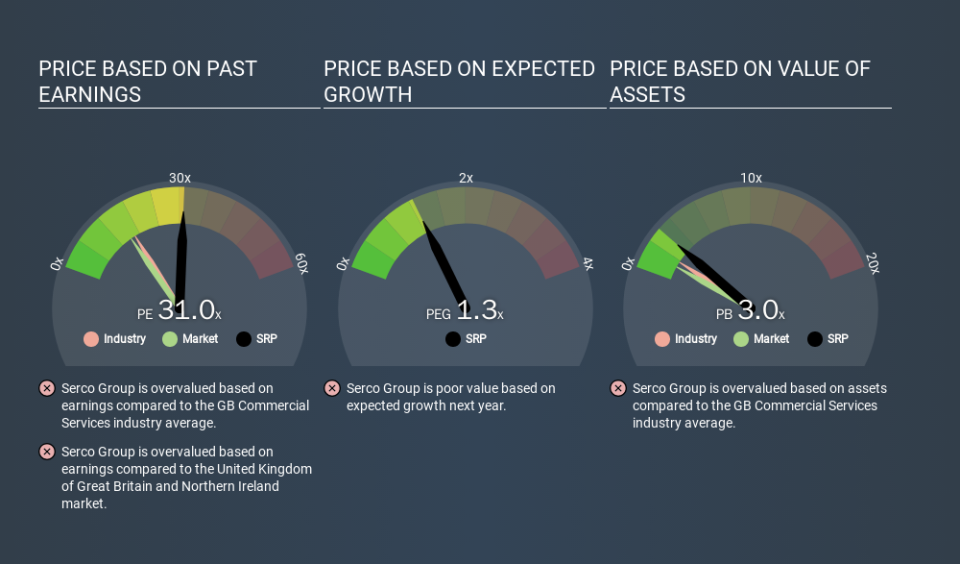
Serco Group's P/E tells us that market participants think the company will perform better than its industry peers, going forward. The market is optimistic about the future, but that doesn't guarantee future growth. So investors should delve deeper. I like to check if company insiders have been buying or selling.
How Growth Rates Impact P/E Ratios
Earnings growth rates have a big influence on P/E ratios. That's because companies that grow earnings per share quickly will rapidly increase the 'E' in the equation. That means even if the current P/E is high, it will reduce over time if the share price stays flat. A lower P/E should indicate the stock is cheap relative to others -- and that may attract buyers.
Serco Group shrunk earnings per share by 30% over the last year. But over the longer term (3 years), earnings per share have increased by 41%.
A Limitation: P/E Ratios Ignore Debt and Cash In The Bank
One drawback of using a P/E ratio is that it considers market capitalization, but not the balance sheet. So it won't reflect the advantage of cash, or disadvantage of debt. In theory, a company can lower its future P/E ratio by using cash or debt to invest in growth.
Spending on growth might be good or bad a few years later, but the point is that the P/E ratio does not account for the option (or lack thereof).
Serco Group's Balance Sheet
Serco Group's net debt is 13% of its market cap. This could bring some additional risk, and reduce the number of investment options for management; worth remembering if you compare its P/E to businesses without debt.
The Bottom Line On Serco Group's P/E Ratio
Serco Group's P/E is 31.0 which is above average (15.1) in its market. With a bit of debt, but a lack of recent growth, it's safe to say the market is expecting improved profit performance from the company, in the next few years.
Investors should be looking to buy stocks that the market is wrong about. As value investor Benjamin Graham famously said, 'In the short run, the market is a voting machine but in the long run, it is a weighing machine. So this free report on the analyst consensus forecasts could help you make a master move on this stock.
But note: Serco Group may not be the best stock to buy. So take a peek at this free list of interesting companies with strong recent earnings growth (and a P/E ratio below 20).
If you spot an error that warrants correction, please contact the editor at editorial-team@simplywallst.com. This article by Simply Wall St is general in nature. It does not constitute a recommendation to buy or sell any stock, and does not take account of your objectives, or your financial situation. Simply Wall St has no position in the stocks mentioned.
We aim to bring you long-term focused research analysis driven by fundamental data. Note that our analysis may not factor in the latest price-sensitive company announcements or qualitative material. Thank you for reading.
