
 Yahoo Finance
 Don't Sell TGS-NOPEC Geophysical Company ASA (OB:TGS) Before You Read This

This article is for investors who would like to improve their understanding of price to earnings ratios (P/E ratios). We'll apply a basic P/E ratio analysis to TGS-NOPEC Geophysical Company ASA's (OB:TGS), to help you decide if the stock is worth further research. Based on the last twelve months, TGS-NOPEC Geophysical's P/E ratio is 17.81. That means that at current prices, buyers pay NOK17.81 for every NOK1 in trailing yearly profits.
See our latest analysis for TGS-NOPEC Geophysical
How Do I Calculate TGS-NOPEC Geophysical's Price To Earnings Ratio?
The formula for P/E is:
Price to Earnings Ratio = Share Price (in reporting currency) ÷ Earnings per Share (EPS)
Or for TGS-NOPEC Geophysical:
P/E of 17.81 = NOK28.63 (Note: this is the share price in the reporting currency, namely, USD ) ÷ NOK1.61 (Based on the trailing twelve months to September 2019.)
Is A High Price-to-Earnings Ratio Good?
A higher P/E ratio means that buyers have to pay a higher price for each NOK1 the company has earned over the last year. All else being equal, it's better to pay a low price -- but as Warren Buffett said, 'It's far better to buy a wonderful company at a fair price than a fair company at a wonderful price.
Does TGS-NOPEC Geophysical Have A Relatively High Or Low P/E For Its Industry?
One good way to get a quick read on what market participants expect of a company is to look at its P/E ratio. The image below shows that TGS-NOPEC Geophysical has a P/E ratio that is roughly in line with the energy services industry average (17.2).
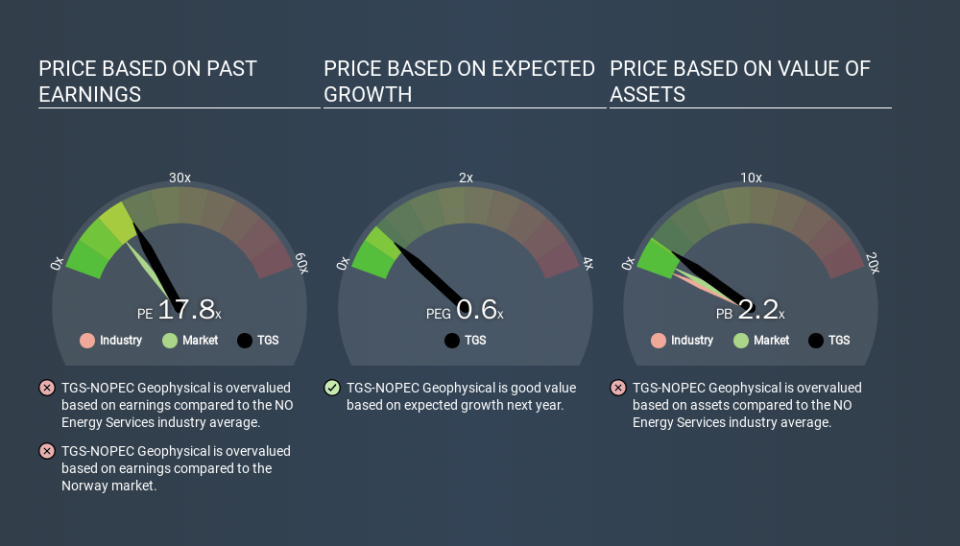
Its P/E ratio suggests that TGS-NOPEC Geophysical shareholders think that in the future it will perform about the same as other companies in its industry classification. If the company has better than average prospects, then the market might be underestimating it. Further research into factors such as insider buying and selling, could help you form your own view on whether that is likely.
How Growth Rates Impact P/E Ratios
P/E ratios primarily reflect market expectations around earnings growth rates. That's because companies that grow earnings per share quickly will rapidly increase the 'E' in the equation. That means unless the share price increases, the P/E will reduce in a few years. A lower P/E should indicate the stock is cheap relative to others -- and that may attract buyers.
TGS-NOPEC Geophysical increased earnings per share by a whopping 49% last year. But earnings per share are down 9.3% per year over the last five years.
A Limitation: P/E Ratios Ignore Debt and Cash In The Bank
It's important to note that the P/E ratio considers the market capitalization, not the enterprise value. So it won't reflect the advantage of cash, or disadvantage of debt. In theory, a company can lower its future P/E ratio by using cash or debt to invest in growth.
Such spending might be good or bad, overall, but the key point here is that you need to look at debt to understand the P/E ratio in context.
TGS-NOPEC Geophysical's Balance Sheet
Since TGS-NOPEC Geophysical holds net cash of US$263m, it can spend on growth, justifying a higher P/E ratio than otherwise.
The Verdict On TGS-NOPEC Geophysical's P/E Ratio
TGS-NOPEC Geophysical has a P/E of 17.8. That's higher than the average in its market, which is 13.3. The excess cash it carries is the gravy on top its fast EPS growth. To us, this is the sort of company that we would expect to carry an above average price tag (relative to earnings).
Investors should be looking to buy stocks that the market is wrong about. People often underestimate remarkable growth -- so investors can make money when fast growth is not fully appreciated. So this free report on the analyst consensus forecasts could help you make a master move on this stock.
Of course you might be able to find a better stock than TGS-NOPEC Geophysical. So you may wish to see this free collection of other companies that have grown earnings strongly.
If you spot an error that warrants correction, please contact the editor at editorial-team@simplywallst.com. This article by Simply Wall St is general in nature. It does not constitute a recommendation to buy or sell any stock, and does not take account of your objectives, or your financial situation. Simply Wall St has no position in the stocks mentioned.
We aim to bring you long-term focused research analysis driven by fundamental data. Note that our analysis may not factor in the latest price-sensitive company announcements or qualitative material. Thank you for reading.
