
 Yahoo Finance
 Don't Sell Tristel Plc (LON:TSTL) Before You Read This

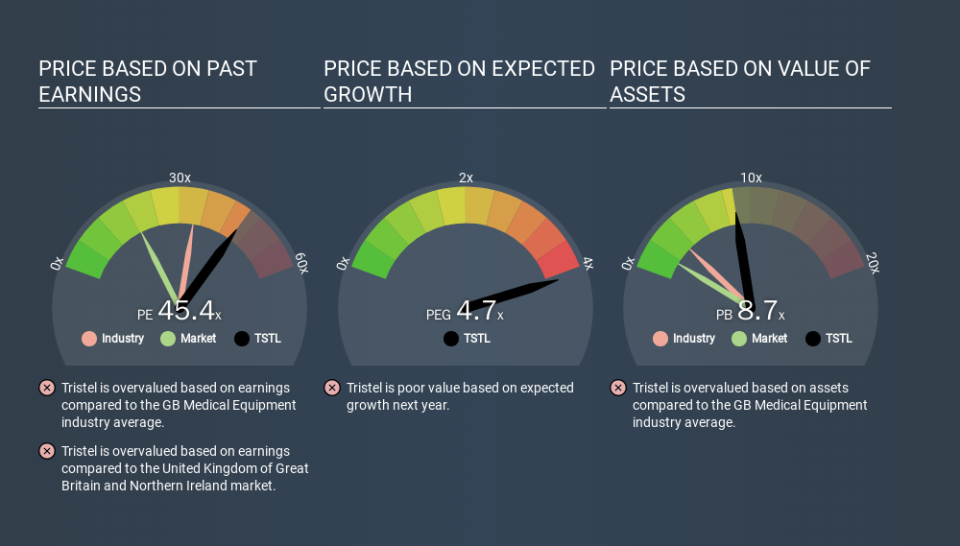
This article is for investors who would like to improve their understanding of price to earnings ratios (P/E ratios). To keep it practical, we'll show how Tristel Plc's (LON:TSTL) P/E ratio could help you assess the value on offer. Tristel has a P/E ratio of 45.42, based on the last twelve months. In other words, at today's prices, investors are paying £45.42 for every £1 in prior year profit.
View our latest analysis for Tristel
How Do You Calculate A P/E Ratio?
The formula for P/E is:
Price to Earnings Ratio = Share Price ÷ Earnings per Share (EPS)
Or for Tristel:
P/E of 45.42 = GBP4.75 ÷ GBP0.10 (Based on the year to December 2019.)
Is A High Price-to-Earnings Ratio Good?
A higher P/E ratio means that buyers have to pay a higher price for each GBP1 the company has earned over the last year. All else being equal, it's better to pay a low price -- but as Warren Buffett said, 'It's far better to buy a wonderful company at a fair price than a fair company at a wonderful price'.
How Does Tristel's P/E Ratio Compare To Its Peers?
The P/E ratio indicates whether the market has higher or lower expectations of a company. The image below shows that Tristel has a higher P/E than the average (32.8) P/E for companies in the medical equipment industry.
Its relatively high P/E ratio indicates that Tristel shareholders think it will perform better than other companies in its industry classification. Clearly the market expects growth, but it isn't guaranteed. So investors should always consider the P/E ratio alongside other factors, such as whether company directors have been buying shares.
How Growth Rates Impact P/E Ratios
Earnings growth rates have a big influence on P/E ratios. If earnings are growing quickly, then the 'E' in the equation will increase faster than it would otherwise. Therefore, even if you pay a high multiple of earnings now, that multiple will become lower in the future. So while a stock may look expensive based on past earnings, it could be cheap based on future earnings.
Notably, Tristel grew EPS by a whopping 30% in the last year. And its annual EPS growth rate over 5 years is 20%. With that performance, I would expect it to have an above average P/E ratio.
Don't Forget: The P/E Does Not Account For Debt or Bank Deposits
The 'Price' in P/E reflects the market capitalization of the company. Thus, the metric does not reflect cash or debt held by the company. Hypothetically, a company could reduce its future P/E ratio by spending its cash (or taking on debt) to achieve higher earnings.
While growth expenditure doesn't always pay off, the point is that it is a good option to have; but one that the P/E ratio ignores.
So What Does Tristel's Balance Sheet Tell Us?
Since Tristel holds net cash of UK£4.2m, it can spend on growth, justifying a higher P/E ratio than otherwise.
The Verdict On Tristel's P/E Ratio
Tristel's P/E is 45.4 which is above average (17.7) in its market. With cash in the bank the company has plenty of growth options -- and it is already on the right track. So it is not surprising the market is probably extrapolating recent growth well into the future, reflected in the relatively high P/E ratio.
When the market is wrong about a stock, it gives savvy investors an opportunity. If the reality for a company is better than it expects, you can make money by buying and holding for the long term. So this free report on the analyst consensus forecasts could help you make a master move on this stock.
But note: Tristel may not be the best stock to buy. So take a peek at this free list of interesting companies with strong recent earnings growth (and a P/E ratio below 20).
If you spot an error that warrants correction, please contact the editor at editorial-team@simplywallst.com. This article by Simply Wall St is general in nature. It does not constitute a recommendation to buy or sell any stock, and does not take account of your objectives, or your financial situation. Simply Wall St has no position in the stocks mentioned.
We aim to bring you long-term focused research analysis driven by fundamental data. Note that our analysis may not factor in the latest price-sensitive company announcements or qualitative material. Thank you for reading.
