
 Yahoo Finance
 Don't Sell United Utilities Group PLC (LON:UU.) Before You Read This

This article is for investors who would like to improve their understanding of price to earnings ratios (P/E ratios). We'll look at United Utilities Group PLC's (LON:UU.) P/E ratio and reflect on what it tells us about the company's share price. What is United Utilities Group's P/E ratio? Well, based on the last twelve months it is 21.58. That corresponds to an earnings yield of approximately 4.6%.
See our latest analysis for United Utilities Group
How Do I Calculate A Price To Earnings Ratio?
The formula for P/E is:
Price to Earnings Ratio = Share Price ÷ Earnings per Share (EPS)
Or for United Utilities Group:
P/E of 21.58 = £9.796 ÷ £0.454 (Based on the year to September 2019.)
(Note: the above calculation results may not be precise due to rounding.)
Is A High P/E Ratio Good?
A higher P/E ratio means that investors are paying a higher price for each £1 of company earnings. That isn't a good or a bad thing on its own, but a high P/E means that buyers have a higher opinion of the business's prospects, relative to stocks with a lower P/E.
How Does United Utilities Group's P/E Ratio Compare To Its Peers?
We can get an indication of market expectations by looking at the P/E ratio. You can see in the image below that the average P/E (17.8) for companies in the water utilities industry is lower than United Utilities Group's P/E.
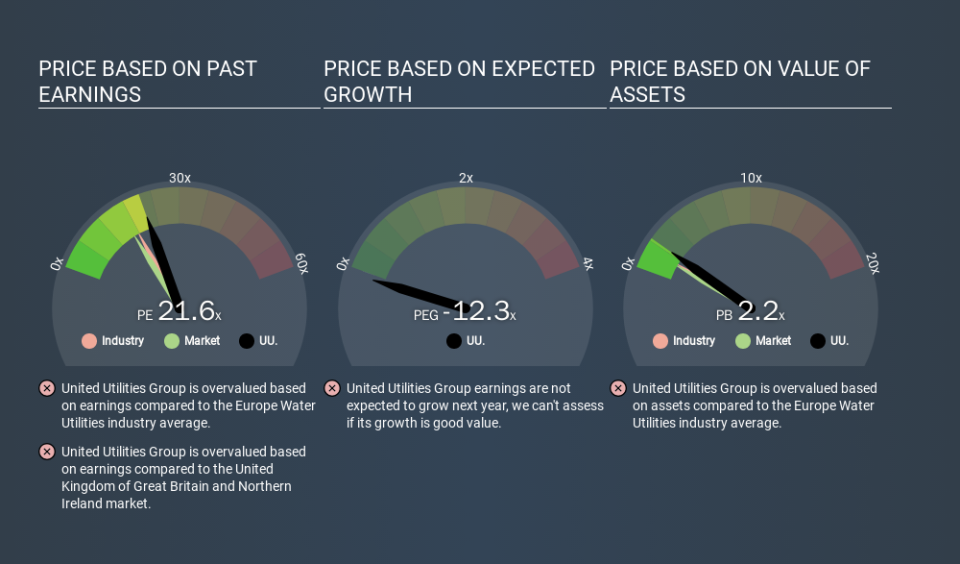
United Utilities Group's P/E tells us that market participants think the company will perform better than its industry peers, going forward. The market is optimistic about the future, but that doesn't guarantee future growth. So investors should delve deeper. I like to check if company insiders have been buying or selling.
How Growth Rates Impact P/E Ratios
When earnings fall, the 'E' decreases, over time. That means even if the current P/E is low, it will increase over time if the share price stays flat. A higher P/E should indicate the stock is expensive relative to others -- and that may encourage shareholders to sell.
United Utilities Group saw earnings per share decrease by 16% last year. And EPS is down 2.7% a year, over the last 5 years. This might lead to muted expectations.
Remember: P/E Ratios Don't Consider The Balance Sheet
The 'Price' in P/E reflects the market capitalization of the company. In other words, it does not consider any debt or cash that the company may have on the balance sheet. Theoretically, a business can improve its earnings (and produce a lower P/E in the future) by investing in growth. That means taking on debt (or spending its cash).
Such expenditure might be good or bad, in the long term, but the point here is that the balance sheet is not reflected by this ratio.
United Utilities Group's Balance Sheet
United Utilities Group has net debt worth a very significant 117% of its market capitalization. If you want to compare its P/E ratio to other companies, you must keep in mind that these debt levels would usually warrant a relatively low P/E.
The Bottom Line On United Utilities Group's P/E Ratio
United Utilities Group trades on a P/E ratio of 21.6, which is above its market average of 16.6. With significant debt and no EPS growth last year, shareholders are betting on an improvement in earnings from the company.
Investors have an opportunity when market expectations about a stock are wrong. As value investor Benjamin Graham famously said, 'In the short run, the market is a voting machine but in the long run, it is a weighing machine. So this free visual report on analyst forecasts could hold the key to an excellent investment decision.
Of course you might be able to find a better stock than United Utilities Group. So you may wish to see this free collection of other companies that have grown earnings strongly.
If you spot an error that warrants correction, please contact the editor at editorial-team@simplywallst.com. This article by Simply Wall St is general in nature. It does not constitute a recommendation to buy or sell any stock, and does not take account of your objectives, or your financial situation. Simply Wall St has no position in the stocks mentioned.
We aim to bring you long-term focused research analysis driven by fundamental data. Note that our analysis may not factor in the latest price-sensitive company announcements or qualitative material. Thank you for reading.
