
 Yahoo Finance
 DoubleDown Interactive's (NASDAQ:DDI) Returns On Capital Tell Us There Is Reason To Feel Uneasy
What financial metrics can indicate to us that a company is maturing or even in decline? More often than not, we'll see a declining return on capital employed (ROCE) and a declining amount of capital employed. This combination can tell you that not only is the company investing less, it's earning less on what it does invest. On that note, looking into DoubleDown Interactive (NASDAQ:DDI), we weren't too upbeat about how things were going.
Return On Capital Employed (ROCE): What Is It?
If you haven't worked with ROCE before, it measures the 'return' (pre-tax profit) a company generates from capital employed in its business. The formula for this calculation on DoubleDown Interactive is:
Return on Capital Employed = Earnings Before Interest and Tax (EBIT) ÷ (Total Assets - Current Liabilities)
0.031 = US$28m ÷ (US$1.0b - US$97m) (Based on the trailing twelve months to June 2022).
Therefore, DoubleDown Interactive has an ROCE of 3.1%. Ultimately, that's a low return and it under-performs the Entertainment industry average of 5.3%.
View our latest analysis for DoubleDown Interactive
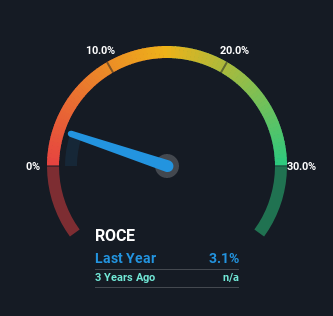
Above you can see how the current ROCE for DoubleDown Interactive compares to its prior returns on capital, but there's only so much you can tell from the past. If you'd like, you can check out the forecasts from the analysts covering DoubleDown Interactive here for free.
The Trend Of ROCE
In terms of DoubleDown Interactive's historical ROCE movements, the trend doesn't inspire confidence. To be more specific, the ROCE was 10% two years ago, but since then it has dropped noticeably. On top of that, it's worth noting that the amount of capital employed within the business has remained relatively steady. Companies that exhibit these attributes tend to not be shrinking, but they can be mature and facing pressure on their margins from competition. So because these trends aren't typically conducive to creating a multi-bagger, we wouldn't hold our breath on DoubleDown Interactive becoming one if things continue as they have.
In Conclusion...
In summary, it's unfortunate that DoubleDown Interactive is generating lower returns from the same amount of capital. Investors haven't taken kindly to these developments, since the stock has declined 48% from where it was year ago. Unless there is a shift to a more positive trajectory in these metrics, we would look elsewhere.
Since virtually every company faces some risks, it's worth knowing what they are, and we've spotted 2 warning signs for DoubleDown Interactive (of which 1 is significant!) that you should know about.
While DoubleDown Interactive isn't earning the highest return, check out this free list of companies that are earning high returns on equity with solid balance sheets.
Have feedback on this article? Concerned about the content? Get in touch with us directly. Alternatively, email editorial-team (at) simplywallst.com.
This article by Simply Wall St is general in nature. We provide commentary based on historical data and analyst forecasts only using an unbiased methodology and our articles are not intended to be financial advice. It does not constitute a recommendation to buy or sell any stock, and does not take account of your objectives, or your financial situation. We aim to bring you long-term focused analysis driven by fundamental data. Note that our analysis may not factor in the latest price-sensitive company announcements or qualitative material. Simply Wall St has no position in any stocks mentioned.
Join A Paid User Research Session
You’ll receive a US$30 Amazon Gift card for 1 hour of your time while helping us build better investing tools for the individual investors like yourself. Sign up here
