
 Yahoo Finance
 Dow Jones 30 and NASDAQ 100 Price forecast for the week of January 15, 2018, Technical Analysis
Dow Jones 30
The Dow Jones 30 broke out to the upside yet again during the week, as we are touching fresh new highs on Friday. The market has gotten a bit overextended, but quite frankly I think that pullbacks will continue to be a buying opportunity. The 25,000 level should now offer a hard “floor”, and should be the basis of any move on a bounce. Longer-term, I don’t see the reason why we drop from here and with the significant drop in the value of the US dollar, I think that the Dow Jones 30 will continue to rally.
Dow Jones 30 and NASDAQ Index Video 15.01.18
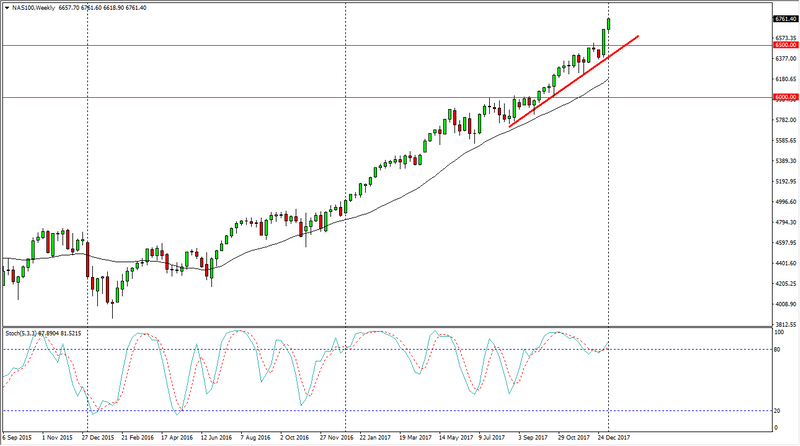
NASDAQ 100
The NASDAQ 100 also broke out to the upside, printing a fresh, new high. It is starting to get accelerated to the upside, which is a good sign considering that it had been lagging other US indices for quite some time. There is a nice uptrend line marked on the chart, and the coinciding 600-6500 level should also offer support. The markets should go looking towards the 7000 level by the end of the year, and the NASDAQ 100 also looks likely to find plenty of opportunity. Short-term pullbacks will be added to on top of the longer-term core positions, as the uptrend line should be a signal of the overall intent. If we can stay above there, it’s a buying opportunity on dips. On the other hand, if we break down below the uptrend line, I think that we would probably drop significantly from there.
This article was originally posted on FX Empire
More From FXEMPIRE:
NZD/USD Price forecast for the week of January 15, 2018, Technical Analysis
Dow Jones 30 and NASDAQ 100 Price forecast for the week of January 15, 2018, Technical Analysis
USD/JPY Price forecast for the week of January 15, 2018, Technical Analysis
AUD/USD Price forecast for the week of January 15, 2018, Technical Analysis
FTSE 100 Price forecast for the week of January 15, 2018, Technical Analysis
USD/CAD forecast for the week of January 15, 2018, Technical Analysis
