
 Yahoo Finance
 Dow Jones 30 and NASDAQ 100 Price forecast for the week of January 8, 2018, Technical Analysis
Dow Jones 30
The Dow Jones 30 rallied significantly during the week, breaking above the shooting star from both of the previous weeks. The 25,000-level broken to the upside is a psychologically significant event, and I think that we are going to continue to find buyers jumping into this market longer term. Pullbacks should be buying opportunities, and at this point I think money managers have signal that they are willing to jump into the equities market with both feet this year. I think we are going to see a move to the upside, and I think that given enough time it’s likely that the dips will be bought as well.
Dow Jones 30 and NASDAQ Index Video 08.01.18
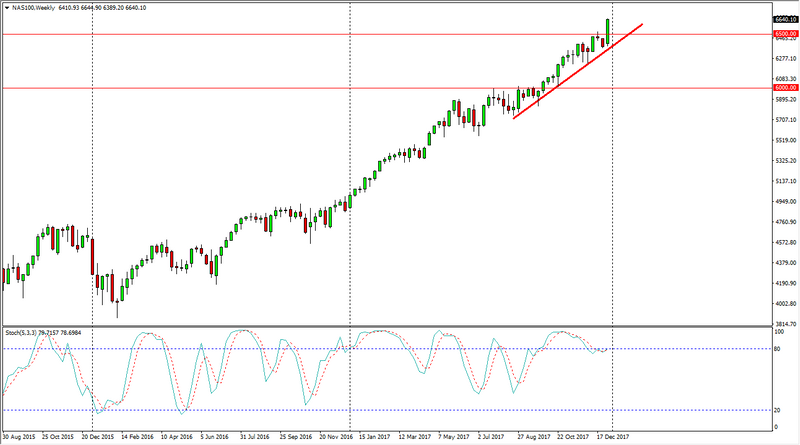
NASDAQ 100
When looking at the weekly chart, you can see that we have followed an uptrend line, and have broken above the 6500 level as well. This is a very bullish sign, and I think that the market is ready to go much higher. Breaking above the 6500 level sends fresh money into the marketplace, and it says that we are ready to go to the 6750-handle next. I think that the markets will eventually find reasons to go higher going forward, although the NASDAQ 100 has been a bit of a laggard when it comes to the other US indices that we follow here at FX Empire. Its bullish, but you may get more momentum out of the other indices.
This article was originally posted on FX Empire
More From FXEMPIRE:
DAX Price forecast for the week of January 8, 2018, Technical Analysis
Natural Gas Price forecast for the week of January 8, 2018, Technical Analysis
BTC/USD Price forecast for the week of January 8, 2018, Technical Analysis
FTSE 100 Price forecast for the week of January 8, 2018, Technical Analysis
GBP/JPY Price forecast for the week of January 8, 2018, Technical Analysis
