
 Yahoo Finance
 Dow Jones 30 and NASDAQ 100 Price Forecast November 15, 2017, Technical Analysis
Dow Jones 30
The Dow Jones 30 went sideways initially during the trading session on Tuesday, but then fell towards the 23,300 level. That is an area where we have seen buyers recently, and it looks as if we are going to continue to try to build up enough momentum to break out above the 23,500 level above which has been resistive. If we can break above there, the market should then go to the 23,620 level. In general, the market is going to be very choppy, and I think that the overall volatility should continue. The 23,250-level underneath should be supportive, but if it does breakdown I think that there is plenty of support at the 23,000 level as well. The market has been in an uptrend for some time, so I look at pullbacks as not opportunities to sell, but opportunities to pick up value.
Dow Jones 31 and NASDAQ Index Video 15.11.17
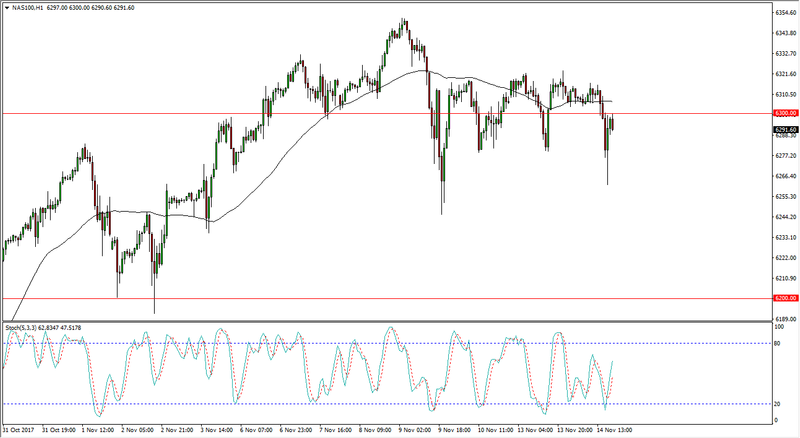
NASDAQ 100
The NASDAQ 100 fell during the day, breaking below the 6300 level again, but as you can see we have bounced a bit. I think the 6300 level is going to continue to offer resistance, at least in the short term. We will break back above there about, as we continue the overall sideways action. When you look at the stochastic oscillator, you can see that we are running out of momentum a little bit, so I think that a pullback makes sense. That pullback should offer plenty of value to take advantage of, and perhaps reaching towards the 6350-level given enough time. I think the 6200-level underneath is the “floor” of the market, and that the NASDAQ 100 will continue to attract money as the corporate earnings have been good, and of course we continue to see plenty of low interest rates around the world.
This article was originally posted on FX Empire
