
 Yahoo Finance
 Dow Jones 30 and NASDAQ 100 Price Forecast January 19, 2018, Technical Analysis
Dow Jones 30
The Dow Jones 30 has drifted a bit lower during the trading session on Thursday, finding support near the 26,000 level. That makes quite a bit of sense, and I think that we will continue to go higher. Ultimately, I think that if we can break to a fresh, new high, it’s likely that we go higher as well. I believe that the Dow Jones 30 continues to be a very strong marketplace, and the recent slowing down of momentum suggests to me that we are going to consolidate a bit, perhaps grind higher. Nonetheless, no matter what happens next, we are going higher.
Dow Jones 30 and NASDAQ Index Video 19.01.18
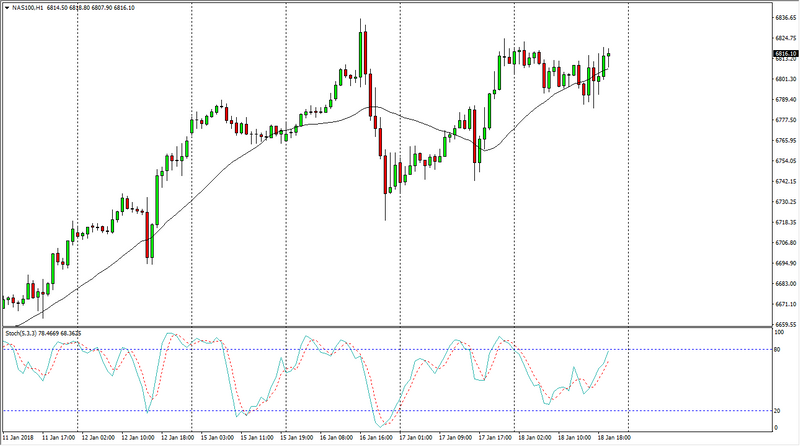
NASDAQ 100
The NASDAQ 100 has drifted a little bit lower during the trading session, but seems to be finding support underneath. If we can break to a fresh, new high, the market should go higher, perhaps reaching towards the 6900-level next. I believe that although the NASDAQ 100 has been a bit of a laggard compared to other US indices, it has been bullish just as everyone else has been. I like buying dips, but in this case, I may wait for a fresh, new high to start putting money to work. Ultimately, I think that pullbacks offer value that you can take advantage of, and I also believe that longer-term investors are probably attracted to the NASDAQ 100. Once we break above the 6900 level, we will then go looking towards the 7000-level next.
This article was originally posted on FX Empire
