
 Yahoo Finance
 Downer EDI (ASX:DOW) Will Want To Turn Around Its Return Trends
If we want to find a potential multi-bagger, often there are underlying trends that can provide clues. Firstly, we'd want to identify a growing return on capital employed (ROCE) and then alongside that, an ever-increasing base of capital employed. Basically this means that a company has profitable initiatives that it can continue to reinvest in, which is a trait of a compounding machine. Having said that, from a first glance at Downer EDI (ASX:DOW) we aren't jumping out of our chairs at how returns are trending, but let's have a deeper look.
Return On Capital Employed (ROCE): What is it?
For those that aren't sure what ROCE is, it measures the amount of pre-tax profits a company can generate from the capital employed in its business. Analysts use this formula to calculate it for Downer EDI:
Return on Capital Employed = Earnings Before Interest and Tax (EBIT) ÷ (Total Assets - Current Liabilities)
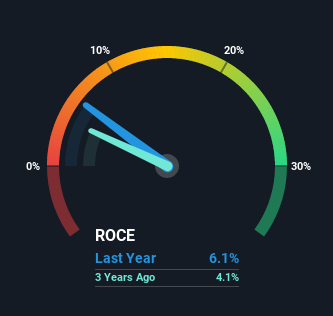
0.061 = AU$292m ÷ (AU$8.1b - AU$3.3b) (Based on the trailing twelve months to June 2021).
Thus, Downer EDI has an ROCE of 6.1%. Ultimately, that's a low return and it under-performs the Commercial Services industry average of 11%.
Check out our latest analysis for Downer EDI
In the above chart we have measured Downer EDI's prior ROCE against its prior performance, but the future is arguably more important. If you're interested, you can view the analysts predictions in our free report on analyst forecasts for the company.
So How Is Downer EDI's ROCE Trending?
On the surface, the trend of ROCE at Downer EDI doesn't inspire confidence. Over the last five years, returns on capital have decreased to 6.1% from 10% five years ago. Meanwhile, the business is utilizing more capital but this hasn't moved the needle much in terms of sales in the past 12 months, so this could reflect longer term investments. It's worth keeping an eye on the company's earnings from here on to see if these investments do end up contributing to the bottom line.
Another thing to note, Downer EDI has a high ratio of current liabilities to total assets of 41%. This effectively means that suppliers (or short-term creditors) are funding a large portion of the business, so just be aware that this can introduce some elements of risk. Ideally we'd like to see this reduce as that would mean fewer obligations bearing risks.
Our Take On Downer EDI's ROCE
Bringing it all together, while we're somewhat encouraged by Downer EDI's reinvestment in its own business, we're aware that returns are shrinking. Unsurprisingly, the stock has only gained 10% over the last five years, which potentially indicates that investors are accounting for this going forward. Therefore, if you're looking for a multi-bagger, we'd propose looking at other options.
On a separate note, we've found 1 warning sign for Downer EDI you'll probably want to know about.
While Downer EDI isn't earning the highest return, check out this free list of companies that are earning high returns on equity with solid balance sheets.
Have feedback on this article? Concerned about the content? Get in touch with us directly. Alternatively, email editorial-team (at) simplywallst.com.
This article by Simply Wall St is general in nature. We provide commentary based on historical data and analyst forecasts only using an unbiased methodology and our articles are not intended to be financial advice. It does not constitute a recommendation to buy or sell any stock, and does not take account of your objectives, or your financial situation. We aim to bring you long-term focused analysis driven by fundamental data. Note that our analysis may not factor in the latest price-sensitive company announcements or qualitative material. Simply Wall St has no position in any stocks mentioned.
