
 Yahoo Finance
 Should DS Smith Plc (LON:SMDS) Be Part Of Your Dividend Portfolio?

Could DS Smith Plc (LON:SMDS) be an attractive dividend share to own for the long haul? Investors are often drawn to strong companies with the idea of reinvesting the dividends. If you are hoping to live on the income from dividends, it's important to be a lot more stringent with your investments than the average punter.
In this case, DS Smith likely looks attractive to investors, given its 4.7% dividend yield and a payment history of over ten years. We'd guess that plenty of investors have purchased it for the income. There are a few simple ways to reduce the risks of buying DS Smith for its dividend, and we'll go through these below.
Click the interactive chart for our full dividend analysis
Payout ratios
Dividends are typically paid from company earnings. If a company pays more in dividends than it earned, then the dividend might become unsustainable - hardly an ideal situation. So we need to form a view on if a company's dividend is sustainable, relative to its net profit after tax. Looking at the data, we can see that 82% of DS Smith's profits were paid out as dividends in the last 12 months. It's paying out most of its earnings, which limits the amount that can be reinvested in the business. This may indicate limited need for further capital within the business, or highlight a commitment to paying a dividend.
We also measure dividends paid against a company's levered free cash flow, to see if enough cash was generated to cover the dividend. The company paid out 82% of its free cash flow as dividends last year, which is adequate, but reduces the wriggle room in the event of a downturn. It's positive to see that DS Smith's dividend is covered by both profits and cash flow, since this is generally a sign that the dividend is sustainable, and a lower payout ratio usually suggests a greater margin of safety before the dividend gets cut.
Is DS Smith's Balance Sheet Risky?
As DS Smith has a meaningful amount of debt, we need to check its balance sheet to see if the company might have debt risks. A rough way to check this is with these two simple ratios: a) net debt divided by EBITDA (earnings before interest, tax, depreciation and amortisation), and b) net interest cover. Net debt to EBITDA is a measure of a company's total debt. Net interest cover measures the ability to meet interest payments. Essentially we check that a) the company does not have too much debt, and b) that it can afford to pay the interest. DS Smith has net debt of 2.92 times its EBITDA. Using debt can accelerate business growth, but also increases the risks.
We calculated its interest cover by measuring its earnings before interest and tax (EBIT), and dividing this by the company's net interest expense. DS Smith has EBIT of 8.31 times its interest expense, which we think is adequate.
We update our data on DS Smith every 24 hours, so you can always get our latest analysis of its financial health, here.
Dividend Volatility
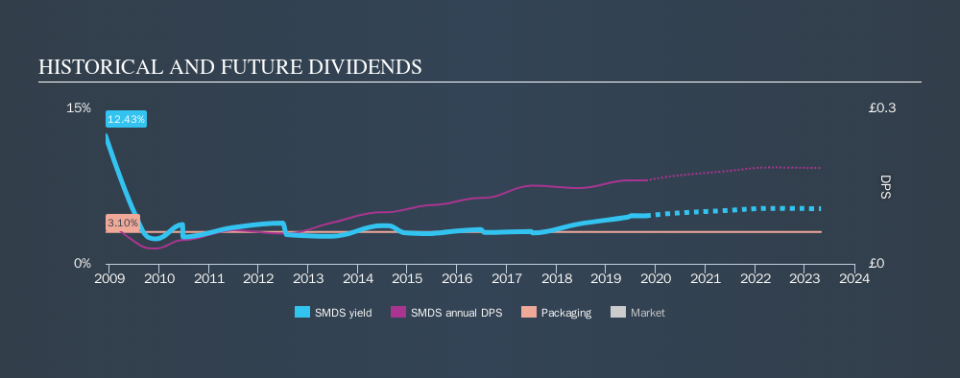
One of the major risks of relying on dividend income, is the potential for a company to struggle financially and cut its dividend. Not only is your income cut, but the value of your investment declines as well - nasty. For the purpose of this article, we only scrutinise the last decade of DS Smith's dividend payments. This dividend has been unstable, which we define as having fallen by at least 20% one or more times over this time. During the past ten-year period, the first annual payment was UK£0.088 in 2009, compared to UK£0.16 last year. Dividends per share have grown at approximately 6.3% per year over this time. The growth in dividends has not been linear, but the CAGR is a decent approximation of the rate of change over this time frame.
It's good to see the dividend growing at a decent rate, but the dividend has been cut at least once in the past. DS Smith might have put its house in order since then, but we remain cautious.
Dividend Growth Potential
With a relatively unstable dividend, it's even more important to see if earnings per share (EPS) are growing. Why take the risk of a dividend getting cut, unless there's a good chance of bigger dividends in future? Earnings have grown at around 5.2% a year for the past five years, which is better than seeing them shrink! EPS have been growing at a reasonable rate, although with most of the profits being paid out to shareholders, we question if the company will be able to keep growing its dividends in the future.
We'd also point out that DS Smith issued a meaningful number of new shares in the past year. Regularly issuing new shares can be detrimental - it's hard to grow dividends per share when new shares are regularly being created.
Conclusion
When we look at a dividend stock, we need to form a judgement on whether the dividend will grow, if the company is able to maintain it in a wide range of economic circumstances, and if the dividend payout is sustainable. First, we think DS Smith is paying out an acceptable percentage of its cashflow and profit. Unfortunately, earnings growth has also been mediocre, and the company has cut its dividend at least once in the past. While we're not hugely bearish on it, overall we think there are potentially better dividend stocks than DS Smith out there.
Earnings growth generally bodes well for the future value of company dividend payments. See if the 12 DS Smith analysts we track are forecasting continued growth with our free report on analyst estimates for the company.
Looking for more high-yielding dividend ideas? Try our curated list of dividend stocks with a yield above 3%.
We aim to bring you long-term focused research analysis driven by fundamental data. Note that our analysis may not factor in the latest price-sensitive company announcements or qualitative material.
If you spot an error that warrants correction, please contact the editor at editorial-team@simplywallst.com. This article by Simply Wall St is general in nature. It does not constitute a recommendation to buy or sell any stock, and does not take account of your objectives, or your financial situation. Simply Wall St has no position in the stocks mentioned. Thank you for reading.
