
 Yahoo Finance
 Dunelm Group's (LON:DNLM) Returns On Capital Not Reflecting Well On The Business
If we want to find a stock that could multiply over the long term, what are the underlying trends we should look for? Firstly, we'll want to see a proven return on capital employed (ROCE) that is increasing, and secondly, an expanding base of capital employed. Put simply, these types of businesses are compounding machines, meaning they are continually reinvesting their earnings at ever-higher rates of return. So while Dunelm Group (LON:DNLM) has a high ROCE right now, lets see what we can decipher from how returns are changing.
Return On Capital Employed (ROCE): What is it?
For those that aren't sure what ROCE is, it measures the amount of pre-tax profits a company can generate from the capital employed in its business. The formula for this calculation on Dunelm Group is:
Return on Capital Employed = Earnings Before Interest and Tax (EBIT) ÷ (Total Assets - Current Liabilities)
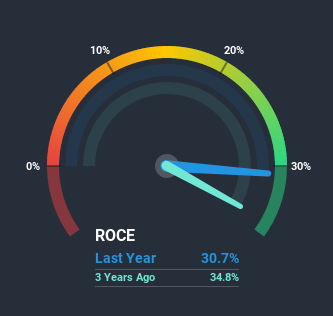
0.31 = UK£165m ÷ (UK£811m - UK£275m) (Based on the trailing twelve months to December 2020).
Thus, Dunelm Group has an ROCE of 31%. In absolute terms that's a great return and it's even better than the Specialty Retail industry average of 12%.
See our latest analysis for Dunelm Group
Above you can see how the current ROCE for Dunelm Group compares to its prior returns on capital, but there's only so much you can tell from the past. If you'd like, you can check out the forecasts from the analysts covering Dunelm Group here for free.
What Does the ROCE Trend For Dunelm Group Tell Us?
When we looked at the ROCE trend at Dunelm Group, we didn't gain much confidence. To be more specific, while the ROCE is still high, it's fallen from 53% where it was five years ago. Meanwhile, the business is utilizing more capital but this hasn't moved the needle much in terms of sales in the past 12 months, so this could reflect longer term investments. It may take some time before the company starts to see any change in earnings from these investments.
The Bottom Line
Bringing it all together, while we're somewhat encouraged by Dunelm Group's reinvestment in its own business, we're aware that returns are shrinking. Although the market must be expecting these trends to improve because the stock has gained 87% over the last five years. However, unless these underlying trends turn more positive, we wouldn't get our hopes up too high.
On a final note, we've found 1 warning sign for Dunelm Group that we think you should be aware of.
If you'd like to see other companies earning high returns, check out our free list of companies earning high returns with solid balance sheets here.
This article by Simply Wall St is general in nature. It does not constitute a recommendation to buy or sell any stock, and does not take account of your objectives, or your financial situation. We aim to bring you long-term focused analysis driven by fundamental data. Note that our analysis may not factor in the latest price-sensitive company announcements or qualitative material. Simply Wall St has no position in any stocks mentioned.
Have feedback on this article? Concerned about the content? Get in touch with us directly. Alternatively, email editorial-team (at) simplywallst.com.
