
 Yahoo Finance
 DX (Group) (LON:DX.) Might Have The Makings Of A Multi-Bagger
Did you know there are some financial metrics that can provide clues of a potential multi-bagger? In a perfect world, we'd like to see a company investing more capital into its business and ideally the returns earned from that capital are also increasing. Ultimately, this demonstrates that it's a business that is reinvesting profits at increasing rates of return. With that in mind, we've noticed some promising trends at DX (Group) (LON:DX.) so let's look a bit deeper.
What Is Return On Capital Employed (ROCE)?
Just to clarify if you're unsure, ROCE is a metric for evaluating how much pre-tax income (in percentage terms) a company earns on the capital invested in its business. The formula for this calculation on DX (Group) is:
Return on Capital Employed = Earnings Before Interest and Tax (EBIT) ÷ (Total Assets - Current Liabilities)
0.17 = UK£24m ÷ (UK£217m - UK£75m) (Based on the trailing twelve months to July 2022).
Therefore, DX (Group) has an ROCE of 17%. That's a relatively normal return on capital, and it's around the 14% generated by the Logistics industry.
See our latest analysis for DX (Group)
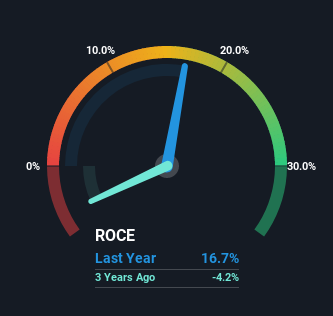
Above you can see how the current ROCE for DX (Group) compares to its prior returns on capital, but there's only so much you can tell from the past. If you'd like, you can check out the forecasts from the analysts covering DX (Group) here for free.
So How Is DX (Group)'s ROCE Trending?
DX (Group) has recently broken into profitability so their prior investments seem to be paying off. The company was generating losses five years ago, but now it's earning 17% which is a sight for sore eyes. And unsurprisingly, like most companies trying to break into the black, DX (Group) is utilizing 422% more capital than it was five years ago. This can indicate that there's plenty of opportunities to invest capital internally and at ever higher rates, both common traits of a multi-bagger.
In another part of our analysis, we noticed that the company's ratio of current liabilities to total assets decreased to 35%, which broadly means the business is relying less on its suppliers or short-term creditors to fund its operations. This tells us that DX (Group) has grown its returns without a reliance on increasing their current liabilities, which we're very happy with.
The Bottom Line
To the delight of most shareholders, DX (Group) has now broken into profitability. And with the stock having performed exceptionally well over the last five years, these patterns are being accounted for by investors. So given the stock has proven it has promising trends, it's worth researching the company further to see if these trends are likely to persist.
On a separate note, we've found 1 warning sign for DX (Group) you'll probably want to know about.
For those who like to invest in solid companies, check out this free list of companies with solid balance sheets and high returns on equity.
Have feedback on this article? Concerned about the content? Get in touch with us directly. Alternatively, email editorial-team (at) simplywallst.com.
This article by Simply Wall St is general in nature. We provide commentary based on historical data and analyst forecasts only using an unbiased methodology and our articles are not intended to be financial advice. It does not constitute a recommendation to buy or sell any stock, and does not take account of your objectives, or your financial situation. We aim to bring you long-term focused analysis driven by fundamental data. Note that our analysis may not factor in the latest price-sensitive company announcements or qualitative material. Simply Wall St has no position in any stocks mentioned.
Join A Paid User Research Session
You’ll receive a US$30 Amazon Gift card for 1 hour of your time while helping us build better investing tools for the individual investors like yourself. Sign up here
