
 Yahoo Finance
 E.ON (ETR:EOAN) shareholders have earned a 10% CAGR over the last five years
When we invest, we're generally looking for stocks that outperform the market average. And the truth is, you can make significant gains if you buy good quality businesses at the right price. For example, long term E.ON SE (ETR:EOAN) shareholders have enjoyed a 31% share price rise over the last half decade, well in excess of the market decline of around 0.5% (not including dividends). However, more recent returns haven't been as impressive as that, with the stock returning just 8.7% in the last year , including dividends .
Let's take a look at the underlying fundamentals over the longer term, and see if they've been consistent with shareholders returns.
See our latest analysis for E.ON
While the efficient markets hypothesis continues to be taught by some, it has been proven that markets are over-reactive dynamic systems, and investors are not always rational. One imperfect but simple way to consider how the market perception of a company has shifted is to compare the change in the earnings per share (EPS) with the share price movement.
During five years of share price growth, E.ON actually saw its EPS drop 34% per year.
Essentially, it doesn't seem likely that investors are focused on EPS. Since the change in EPS doesn't seem to correlate with the change in share price, it's worth taking a look at other metrics.
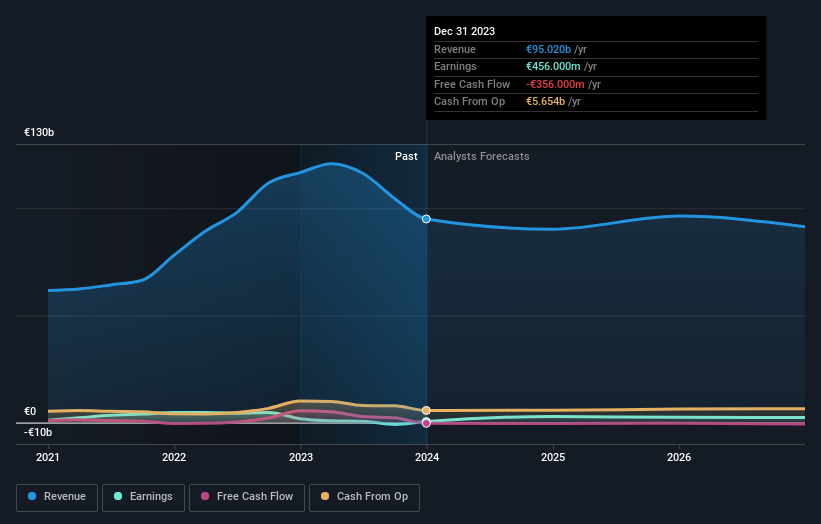
In fact, the dividend has increased over time, which is a positive. Maybe dividend investors have helped support the share price. The revenue growth of about 26% per year might also encourage buyers.
The graphic below depicts how earnings and revenue have changed over time (unveil the exact values by clicking on the image).
E.ON is well known by investors, and plenty of clever analysts have tried to predict the future profit levels. So we recommend checking out this free report showing consensus forecasts
What About Dividends?
As well as measuring the share price return, investors should also consider the total shareholder return (TSR). The TSR incorporates the value of any spin-offs or discounted capital raisings, along with any dividends, based on the assumption that the dividends are reinvested. It's fair to say that the TSR gives a more complete picture for stocks that pay a dividend. In the case of E.ON, it has a TSR of 65% for the last 5 years. That exceeds its share price return that we previously mentioned. The dividends paid by the company have thusly boosted the total shareholder return.
A Different Perspective
We're pleased to report that E.ON shareholders have received a total shareholder return of 8.7% over one year. Of course, that includes the dividend. Having said that, the five-year TSR of 10% a year, is even better. I find it very interesting to look at share price over the long term as a proxy for business performance. But to truly gain insight, we need to consider other information, too. Case in point: We've spotted 3 warning signs for E.ON you should be aware of, and 2 of them are significant.
Of course E.ON may not be the best stock to buy. So you may wish to see this free collection of growth stocks.
Please note, the market returns quoted in this article reflect the market weighted average returns of stocks that currently trade on German exchanges.
Have feedback on this article? Concerned about the content? Get in touch with us directly. Alternatively, email editorial-team (at) simplywallst.com.
This article by Simply Wall St is general in nature. We provide commentary based on historical data and analyst forecasts only using an unbiased methodology and our articles are not intended to be financial advice. It does not constitute a recommendation to buy or sell any stock, and does not take account of your objectives, or your financial situation. We aim to bring you long-term focused analysis driven by fundamental data. Note that our analysis may not factor in the latest price-sensitive company announcements or qualitative material. Simply Wall St has no position in any stocks mentioned.
