
 Yahoo Finance
 E-mini Dow Jones Industrial Average (YM) Futures Analysis – May 21, 2018 Forecast
June E-mini Dow Jones Industrial Average futures are trading higher shortly after the cash market opening. The market is in a position to test last week’s high and a major retracement zone that is controlling the longer-term direction of the Dow.
Daily Swing Chart Technical Analysis
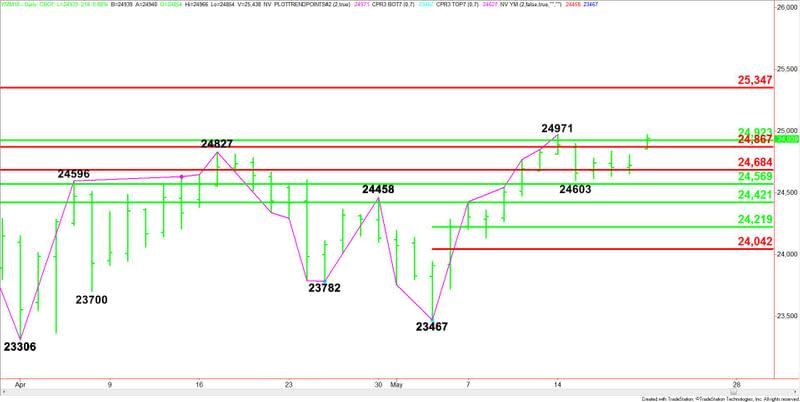
The main trend is up according to the daily swing chart. A trade through 24971 will signal a resumption of the uptrend.
A trade through 24603 will turn the minor trend down and shift momentum to the downside.
The major upside target is a long-term retracement zone at 24923 to 25347.
On the downside, potential support levels are layered at 24867, 24684 and 24569.
Daily Swing Chart Technical Forecast
Based on the early price action, the direction of the Dow today is likely to be determined by trader reaction to the major 50% level at 24923.
A sustained move over 24923 will signal the presence of buyers. This could trigger a move into last week’s high at 24971.
Taking out 24971 will signal a resumption of the uptrend which stalled last week. This is a potential trigger point for an acceleration into the major Fibonacci level at 25347.
A sustained move under 24923 will indicate the presence of sellers. This could trigger a quick move into 24867. This is a potential trigger point for an acceleration into 24674, followed by a minor bottom at 24603 and 24569.
This article was originally posted on FX Empire
More From FXEMPIRE:
Market Snapshot – Dollar Shoots Higher on Growing Anticipation
E-mini S&P 500 Index (ES) Futures Technical Analysis – May 21, 2018 Forecast
RoboForex has Introduced an Opportunity to Buy Bitcoin Using Fiat Currencies
Crude Tests Resistance as Chinese and U.S. Trade Spat Abates
Gold Price Futures (GC) Technical Analysis – May 21, 2018 Forecast
