
 Yahoo Finance
 E-mini Dow Jones Industrial Average (YM) Futures Analysis – May 24, 2018 Forecast
June E-mini Dow Jones Industrial Average futures are trading lower shortly after the opening. Pressuring the Dow is weakness in the energy sector and concerns over U.S. trade. Underpinning the Dow is the Fed’s dovish stance toward future rate hikes.
Daily Swing Chart Technical Analysis
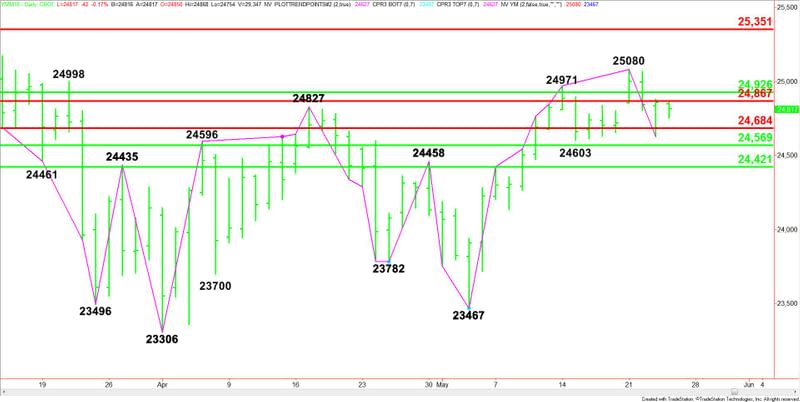
The main trend is up according to the daily swing chart. A trade through 25080 will signal a resumption of the uptrend.
A move through 24603 will change the minor trend to down. This will also change momentum to the downside.
The Dow is also caught between a few retracement levels. This is helping to cause the sideways or two-sided trade.
On the upside, the first resistance is a Fibonacci level at 24867 and a major 50% level at 24926.
On the downside, the support levels are layered at 24684, 24569 and 24421.
Daily Swing Chart Technical Forecast
Based on the early trade, the direction of the Dow today is likely to be determined by trader reaction to the Fib level at 24867.
A sustained move under 24867 will signal the presence of sellers. If this generates enough downside pressure, look for a break into 24684, yesterday’s low at 24627, a minor bottom at 24603 and a 50% level at 24569.
Taking out 24867 and sustaining the move will indicate the presence of buyers. This is followed by the major 50% level at 24926.
Overcoming 24926 will put the Dow in a strong position. This could trigger a rally into this week’s high and main top at 25080.
Looking at the bigger picture, look for an upside bias to develop on a sustained move over 24926 and for a downside bias to develop on a sustained move under 24421.
This article was originally posted on FX Empire
