
 Yahoo Finance
 E-mini Dow Jones Industrial Average (YM) Futures Analysis – August 17, 2017 Forecast
September E-mini Dow Jones Industrial Average futures are trading lower shortly after the opening. The main trend is up according to the daily swing chart, however, momentum appears to be ready to shift to the downside. Additionally, it looks as if a potentially bearish secondary lower top is forming. This tends to indicate the selling is greater than the buying at current price levels.
A trade through 22067 will signal a resumption of the uptrend. This could lead to a test of the main top at 22132.
The market is currently testing a retracement zone at 21961 to 22001. Trader reaction to this zone is likely to determine the near the near-term direction of the market.
The short-term range is 21790 to 22067. If the selling continues then look for a further break into its retracement zone at 21929 to 21896.
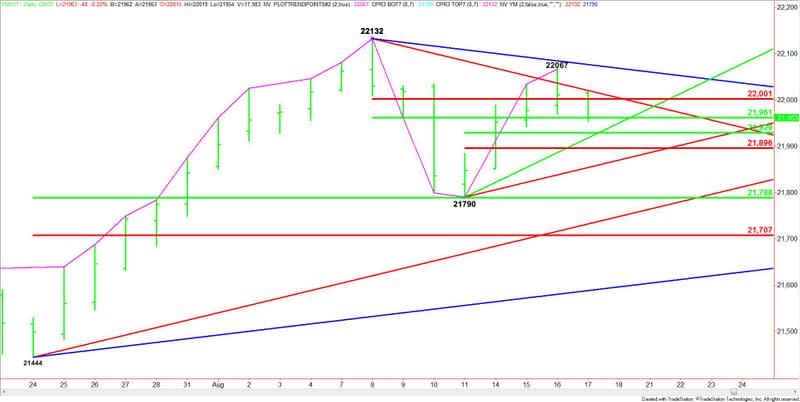
The direction of the Dow today is likely to be determined by trader reaction to the 50% level at 21961.
A sustained move over 21961 will signal the presence of buyers. This could trigger a rally into the Fibonacci level at 22001, followed by the downtrending angle at 22020. This is a potential trigger point for an acceleration into the minor top at 22067, followed by a downtrending angle at 22076. The latter is the last potential resistance angle before the 22132 main top.
A sustained move under 21961 will indicate the presence of sellers. This is followed by a cluster of levels at 21929, 21918 and 21896.
The daily chart opens up to the downside under 21896 with the next target angle coming in at 21854. This is the last potential support angle before the 21790 main bottom.
If 21790 fails as support then look for the selling pressure to take the market into the main retracement zone at 21788 to 21707.
This article was originally posted on FX Empire
More From FXEMPIRE:
E-mini Dow Jones Industrial Average (YM) Futures Analysis – August 17, 2017 Forecast
E-mini NASDAQ-100 Index (NQ) Futures Technical Analysis – August 17, 2017 Forecast
E-mini S&P 500 Index (ES) Futures Technical Analysis – August 17, 2017 Forecast
Major US Indices Forecast, August 17, 2017, Technical Analysis
