
 Yahoo Finance
 E-mini Dow Jones Industrial Average (YM) Futures Technical Analysis – Strong Over 26298, Weak Under 25938
September E-mini Dow Jones Industrial Average futures are trading higher shortly after the cash market opening. Traders are looking to build on last week’s strong gains after getting help from a surge in the Chinese stock market. U.S. traders continue to bet on a speedy recovery despite rising coronavirus infections.
At 13:55 GMT, September E-mini Dow Jones industrial Average futures are at 26143, up 384 or +1.51%.
Blue chip shares have rallied despite a surge in new cases in the populous U.S. states of Florida, Texas and California. That has prompted some governors to halt reopening of businesses or to order others to re-close.
Additionally, stocks in Shanghai rose nearly 6%. Treasury yields also climbed, sending another signal of improved optimism. Indexes in London and Frankfort also rose after Shanghai led the rally in Asia.
Daily Swing Chart Technical Analysis
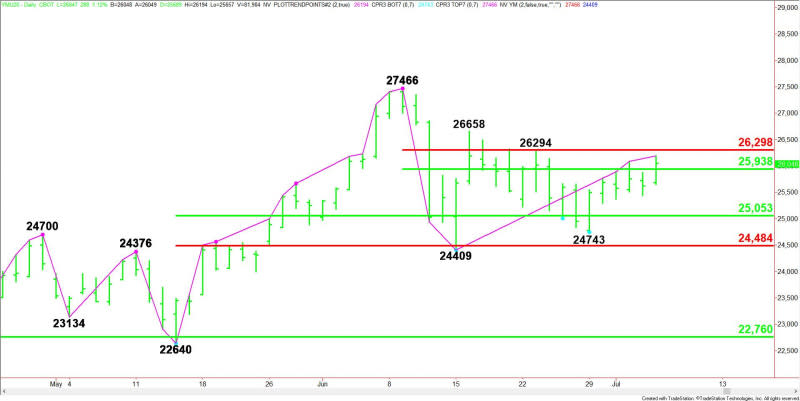
The main trend is up according to the daily swing chart. A trade through 27466 will signal a resumption of the uptrend. The main trend will change to down on a trade through 24409.
The short-term range is 27466 to 24409. Its retracement zone at 25938 to 26298 is potential resistance. It is currently being tested.
The main range is 22640 to 27466. Its retracement zone at 25053 to 24484 is support.
Daily Swing Chart Technical Forecast
Based on the early price action and the current price at 26143, the direction of the September E-mini Dow Jones Industrial Average the rest of the session on Monday is likely to be determined by trader reaction to the short-term 50% level at 25938.
Bullish Scenario
A sustained move over 25938 will indicate the presence of buyers. The next upside target is the Fibonacci level at 26298. This is a potential trigger point for an acceleration into the minor top at 26658. Overcoming and sustaining a rally over this level could drive the market into the next main top at 27466.
Bearish Scenario
A sustained move under 25938 will signal the presence of sellers. If this move creates enough downside momentum then look for a move into a minor pivot at 25468, followed by the main 50% level at 25053.
For a look at all of today’s economic events, check out our economic calendar.
This article was originally posted on FX Empire
More From FXEMPIRE:
The Big Short #2 – World Pushes Credit/Investments Into Risk Again, Part I
Crude Oil Price Forecast – Crude Oil Markets Continue to Test Upside
USD/CAD Daily Forecast – U.S. Dollar Under Pressure Amid Global Market Optimism
E-mini S&P 500 Index (ES) Futures Technical Analysis – Traders Have Sights Set on 3220.50
Silver Price Forecast – Silver Markets Continue to Stretch Higher
