
 Yahoo Finance
 E-mini NASDAQ-100 Index (NQ) Futures Technical Analysis – Trade Through 9144.75 Reaffirms Uptrend
June E-mini NASDAQ-100 Index futures rose on Wednesday on hopes of a pickup in business activity as states eased coronavirus-induced curbs, with investors also looking past a stunning 20 million plunge in U.S. private payrolls last month.
Despite the gains, declining issues outnumbered advancers 1.08-to-1 ratio on the NASDAQ. The NASDAQ also recorded 46 new highs and 14 new lows.
Part of the reason for the strength in the index is that investors are increasing their exposure to companies like Amazon and Microsoft, while taking speculative positions in stocks that benefit from stay-at-home economy.
On Wednesday, June E-mini NASDAQ-100 Index futures settled at 8952.00, up 27.75 or +0.31%.
Daily Swing Chart Technical Analysis
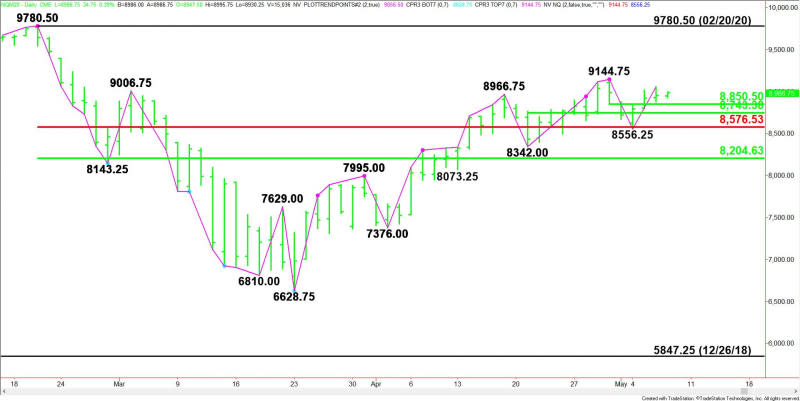
The main trend is up according to the daily swing chart, however, momentum has been trending lower since the formation of the closing price reversal top on April 30.
A trade through 9144.75 will negate the closing price reversal top and signal a resumption of the uptrend. The main trend will change to down on a trade through the last swing bottom at 8556.25.
The minor range is 9144.75 to 8556.25. Its 50% level at 8850.50 is support.
The short-term range is 8342.00 to 9144.75. Its 50% level at 8743.25 is additional support.
The main range is 9780.50 to 6628.75. Its retracement zone at 8576.50 to 8204.50 is major support. This zone is also controlling the longer-term direction of the index.
Daily Swing Chart Technical Forecast
Based on Wednesday’s price action and the close at 8924.75, the direction of the June E-mini NASDAQ-100 Index on Thursday is likely to be determined by trader reaction to the minor pivot at 8850.50.
Bullish Scenario
A sustained move over 8850.50 will indicate the presence of buyers. If this continues to generate enough upside momentum then look for a retest of the main top at 9144.75.This is a potential trigger point for an acceleration to the upside.
Bearish Scenario
A sustained move under 8850.50 will signal the presence of sellers. The next target is the short-term 50% level at 8743.25. This is a potential trigger point for an acceleration into the major Fibonacci level at 8576.50 and the main bottom at 8556.25.
This article was originally posted on FX Empire
