E-mini NASDAQ-100 Index (NQ) Futures Technical Analysis – Despite Bearish Close, Upside Momentum Still Strong
March E-mini NASDAQ-100 Index futures are trading nearly flat after regaining its initial loss. The early weakness was fueled by a weaker Asian trade. Investors are continuing to monitor the ongoing virus outbreak’s impact on Chinese manufacturers, but if last week’s price action is any indication, most investors feel the worst of the outbreak will be contained in the country.
At 05:31 GMT, March E-mini NASDAQ-100 Index futures are at 9417.50, up 8.00 or +0.09%.
There are no major economic releases in the U.S. on Monday, but earnings season will continue. A couple of FOMC members will give speeches, but investors are primarily focused on the testimony of Fed Chair Jerome Powell on Tuesday and Wednesday.

Daily Swing Chart Technical Analysis
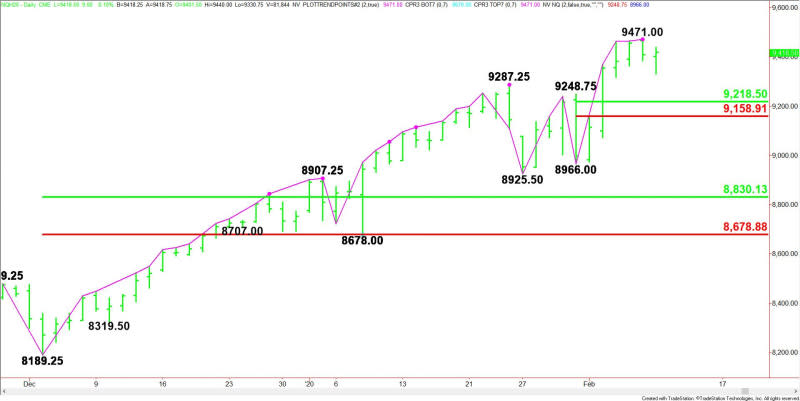
The main trend is up according to the daily swing chart, but momentum shifted to the downside earlier in the session when sellers confirmed Friday’s closing price reversal top by taking out 9385.00.
The chart pattern doesn’t indicate a change in trend, but it could lead to a 2 to 3 day correction with the next target a short-term 50% to 61.8% retracement zone.
A trade through 9471.00 will negate the closing price reversal top and signal a resumption of the uptrend.
The short-term range is 8966.00 to 8471.00. Its retracement zone at 9218.50 to 9159.00 is the first downside target.
Daily Swing Chart Technical Forecast
The direction of the March E-mini NASDAQ-100 Index futures contract the rest of the session on Monday is likely to be determined by trader reaction to the current intraday low at 9330.75.
Bullish Scenario
A sustained move over 9330.75 will indicate the presence of buyers. Overtaking Friday’s low at 9385.00 and Friday’s close at 9409.50 will indicate the buying is getting stronger. This could create enough upside momentum to challenge the all-time high at 9471.00. Taking out this level could trigger an acceleration to the upside.
Bearish Scenario
The first sign of weakness later today will be a break under Friday’s close at 9409.50. A break back under 9401.00 will indicate the selling pressure is getting stronger. Taking out the intraday low at 9330.75 could trigger an acceleration to the downside with the next major target the short-term retracement zone at 9218.50 to 9159.00.
Since the main trend is up, watch for buyers on the first test of 9218.50 to 9159.00. Look for further weakness if 9159.00 is taken out with heavy selling volume.
This article was originally posted on FX Empire
More From FXEMPIRE:
Price of Gold Fundamental Daily Forecast – Steady Buying Keeping Rally Afloat
EOS, Ethereum and Ripple’s XRP – Daily Tech Analysis – 10/02/20
European Equities: A Lack of Economic Data Leaves Coronavirus Updates and Geopolitical Risk in Focus
GBP/USD Daily Forecast – Sterling Attempts to Hold Above 100-Day Moving Average

 Yahoo Finance