
 Yahoo Finance
 E-mini NASDAQ-100 Index (NQ) Futures Technical Analysis – June 19, 2018 Forecast
September E-mini NASDAQ-100 Index futures are trading over 1 percent lower during the pre-market session. The catalysts behind the move are the threat of $200 billion additional tariffs against China by President Trump and China’s promise of retaliation.
Daily Technical Analysis
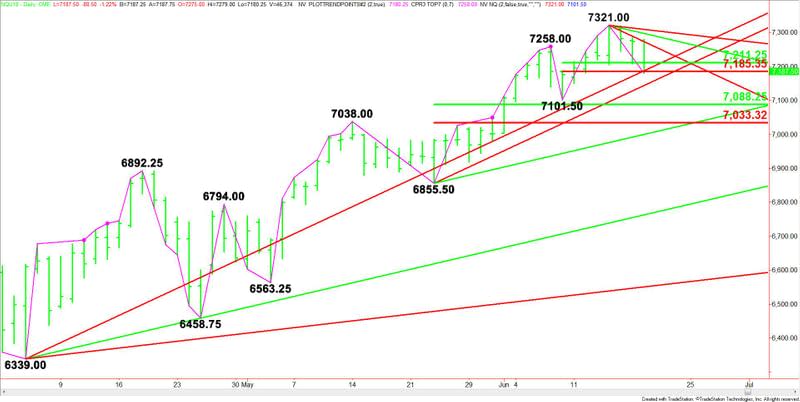
The main trend is up according to the daily swing chart, however, momentum is trending lower. A trade through 7321.00 will signal a resumption of the uptrend. A move through 7101.50 will change the main trend to down.
The minor trend is down. It turned down earlier today when sellers took out the minor bottom at 7205.25. This move also shifted momentum to the downside.
The short-term range is 7101.50 to 7321.00. Its retracement zone at 7211.25 to 7185.25 is currently being tested.
The next short-term range is 6855.50 to 7321.00. Its retracement zone at 7088.25 to 7033.25 is the next downside target.
Daily Technical Forecast
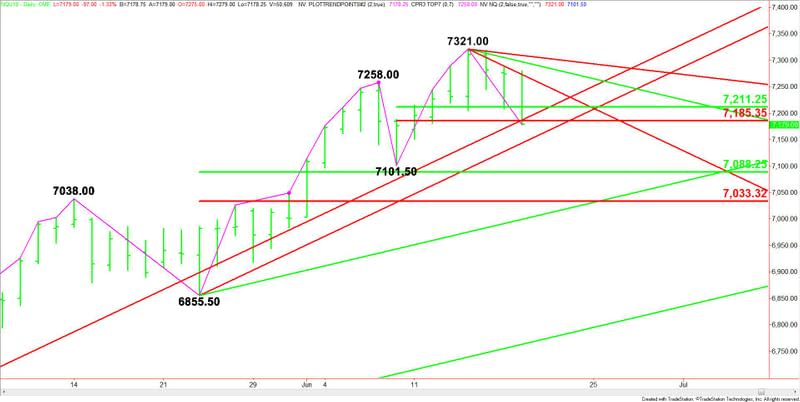
Based on the early price action and the current price at 7187.50, the direction of the September E-mini NASDAQ-100 Index the rest of the session is likely to be determined by trader reaction to an uptrending Gann angle at 7187.00 and the short-term Fibonacci level at 7185.25.
A sustained move over 7187.00 will indicate the presence of buyers. If this move generates enough upside momentum, we could see a test of the short-term 50% level at 7211.25.
Overtaking 7211.25 will indicate the buying is getting stronger. This could trigger a test of a steep downtrending Gann angle at 7273.00. This angle has been guiding the index lower for three days.
A move through 7273.00 could trigger a breakout into downtrending Gann angles at 7297.00 and 7309.00. The latter is the last potential resistance angle before the 7321.00 main top.
A sustained move under 7185.25 will signal the presence of sellers. This could trigger a quick break into a short-term uptrending Gann angle at 7143.00. We could see a technical bounce on the first test of this angle, but if it fails then look for an acceleration to the downside with the next targets 7101.50 and 7088.25.
A failure at 7088.25 will also fuel a further break into the Fibonacci level at 7033.25, followed by an uptrending Gann angle at 6999.00.
Basically, look for an upside bias to develop on a sustained move over 7187.00 and for the downside bias to continue on a sustained move under 7185.25.
This article was originally posted on FX Empire
