
 Yahoo Finance
 E-mini NASDAQ-100 Index (NQ) Futures Technical Analysis – October 19, 2017 Forecast
December E-mini NASDAQ-100 Index futures are expected to open sharply lower based on the pre-market trade. Early in the session, the index crossed to the weak side of a steep uptrending angle and confirmed a closing price reversal top, both potentially bearish moves.
Daily Technical Analysis
The main trend is up according to the daily swing chart. However, momentum shifted to the downside with the formation of yesterday’s closing price reversal top and subsequent follow-through to the downside.
A trade through 6132.75 will negate the chart pattern and signal a resumption of the uptrend.
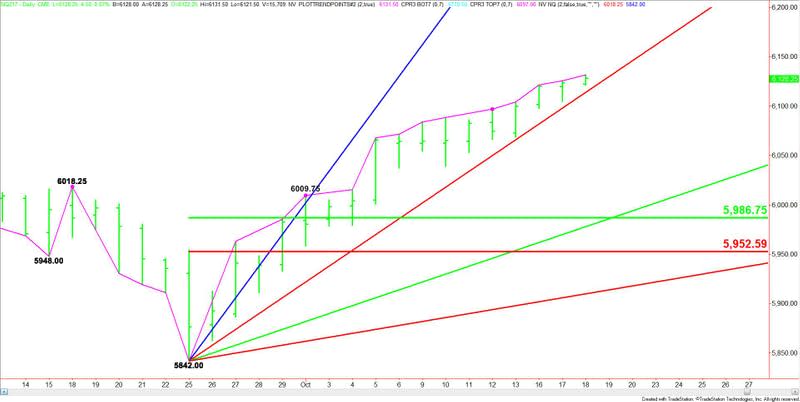
The main range is 5842.00 to 6132.75. If the selling pressure continues then its retracement zone at 5987.25 to 5953.00 will become the primary downside target.
Daily Forecast
Overtaking a steep uptrending angle at 6130.00 will put the index in a bullish position. This could create the upside momentum needed to take out 6132.75.
The daily chart is wide open to the downside with the main target a support cluster at 5987.25 to 5986.00. We could see a technical bounce on the first test of this area. Since the main trend is up, buyers are likely to step in.
If 5986.00 fails as support then look for the selling to extend into 5953.00.
Last week’s close was 6099.75. The index is now trading on the weak side of this level, putting the market in a position to post a potentially bearish weekly closing price reversal top.
This article was originally posted on FX Empire
