
 Yahoo Finance
 E-mini NASDAQ-100 Index (NQ) Futures Technical Analysis – September 25, 2017 Forecast
December E-mini NASDAQ-100 Index futures are trading lower shortly before the cash market opening. The index traded higher early in the pre-market session but turned lower as investors raised concerns over the Republicans’ ability to pass healthcare reform and the surprising election results in Germany. Traders are also monitoring Apple stock which dragged down the index last week.
Later today, investors will get the opportunity to react to several Fed speakers including FOMC Members William Dudley, Charles Evans, and Neel Kashkari. Their speeches could cause volatility in the market especially if they talk about monetary policy and the timing of the next rate hike.
Daily Technical Analysis
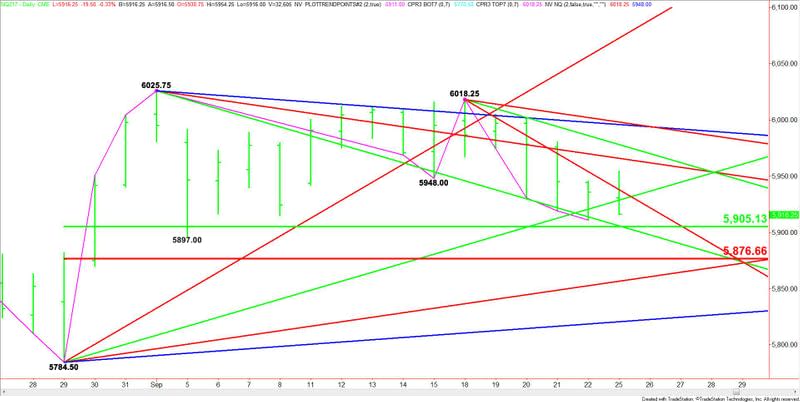
The main trend is down according to the daily swing chart. The trend will turn up on a trade through 6018.25. The first downside target is the minor bottom at 5897.00. This is followed by the main bottom at 5784.50.
The main range is 5784.50 to 6025.75. Its retracement zone at 5905.00 to 5876.50 is the primary downside target. Don’t be surprised if we see aggressive counter-trend buying on the first test of this zone. This retracement area is essentially controlling the longer-term direction of the market.
Daily Forecast
Based on the earlier price action, the direction of the index today is likely to be determined by a pair of Gann angles at 5928.50 and 5938.25.
A sustained move under 5928.50 will indicate the presence of sellers. This could trigger a break into the price cluster at 5905.75 to 5905.00. Watch for a bounce on the initial test of this area.
If 5905.00 fails as support then look for a possible acceleration to the downside with 5876.50 the next target. This is followed by an uptrending angle at 5856.50.
Overtaking and sustaining a rally over 5938.25 will signal the presence of buyers. This could drive the index into 5965.75 and 5978.25.
Look for a bearish tone on a sustained move under 5928.50 and a bullish tone to develop over 5938.25.
This article was originally posted on FX Empire
