
 Yahoo Finance
 E-mini NASDAQ-100 Index (NQ) Futures Technical Analysis – December 12, 2017 Forecast
March E-mini NASDAQ-100 Index futures are trading flat shortly before the cash market opening. Buyers appear to be backing off as the market approaches the contract high. Volume could be below average ahead of Wednesday’s U.S. Federal Reserve interest rate decision and monetary policy statement.
Daily Technical Analysis
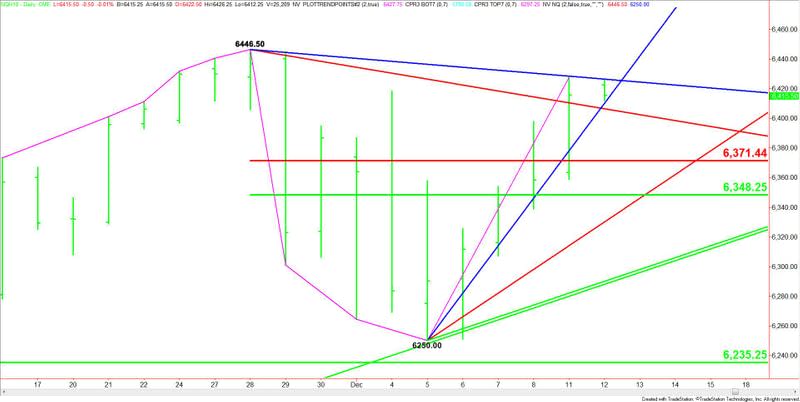
The main trend is up according to the daily swing chart. A trade through 6446.50 will signal a resumption of the uptrend. Today is the fifth day up from the 6250.00 main bottom. In a couple of days, the market will be in the window of time for a potentially bearish closing price reversal top. However, traders should start watching for early signs of a top.
The short-term range is 6446.50 to 6250.00. Its retracement zone at 6371.50 to 6348.25 is new support. Holding above this zone will also give the market an upside bias.
Daily Technical Forecast
Based on the early price action, the direction of the index today will be determined by trader reaction to the steep uptrending Gann angle at 6410.00.
A sustained move over 6410.00 will indicate the presence of buyers. The first upside target is a downtrending Gann angle at 6426.50. This is the last potential resistance angle before the 6446.50 main top.
A sustained move under 6410.00 will signal the presence of sellers. Taking out the downtrending angle at 6406.50 will indicate that the selling is getting stronger. This could trigger an acceleration to the downside with the next major target the Fibonacci level at 6371.50.
Basically, look for a bullish tone to develop on a sustained move over 6426.50 and for a bearish tone to develop on a sustained move under 6406.50.
This article was originally posted on FX Empire
