
 Yahoo Finance
 E-mini NASDAQ-100 Index (NQ) Futures Technical Analysis – November 10, 2017 Forecast
Daily December E-mini NASDAQ-100 Index futures are called lower based on the pre-market trade. The market is trading inside yesterday’s range which suggests investor indecision and impending volatility. The index is also trading slightly above last week’s close at 6290.50. A close below this level will produce a potentially bearish weekly closing price reversal top.
Daily Technical Analysis
The main trend is up according to the daily swing chart. However, while not the best closing price reversal top, the higher-high, lower-close and close below the opening suggests the selling may be greater than the buying at current price levels. This also indicates a shift in momentum to down.
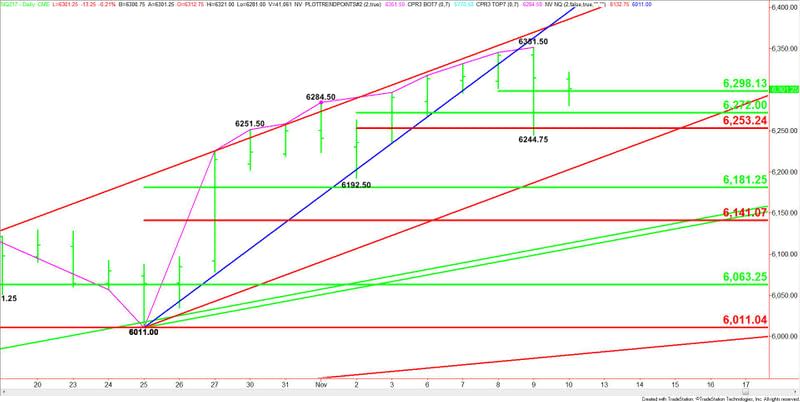
A trade through 6351.50 will signal a resumption of the uptrend. A move through 6244.75 will mean the selling is getting stronger. A trade through 6192.50 will change the minor trend to down.
The price action is also being controlled by a number of retracement levels.
The short-term range is 6351.50 to 6244.75. Its 50% level or pivot is 6298.00.
The intermediate range is 6192.50 to 6351.50. Its retracement zone at 6272.00 to 6253.25 provided support on Thursday.
The main range is 6011.00 to 6351.50. Its retracement zone at 6181.25 to 6141.00 is the first major downside target.
Daily Technical Forecast
Based on the early price action, the direction of the index today is likely to be determined by trader reaction to the short-term pivot at 6298.00.
A sustained move over 6298.00 will indicate the presence of buyers. If this creates enough upside momentum then look for a possible drive into the high at 6351.50 and the steep long-term uptrending angle at 6385.75. Crossing to the strong side of this angle will put the index in a bullish position.
A sustained move under 6298.00 will signal the presence of sellers. This could lead to a quick test of 6272.00, 6253.25 and 6244.75.
The daily chart starts to open up to the downside under 6244.75. This could trigger a move into the next uptrending angle at 6059.00. Since the trend is up, we could see a technical bounce on a test of this angle.
If 6059.00 fails as support then look for the selling to extend into the retracement zone at 6181.25 to 6141.00.
This article was originally posted on FX Empire
