
 Yahoo Finance
 E-mini NASDAQ-100 Index (NQ) Futures Technical Analysis – January 8, 2018 Forecast
March E-mini NASDAQ-100 Index futures are trading lower shortly after the cash market opening. The market rallied to a new high early in the session before turning lower. This puts the index in a position to form a potentially bearish closing price reversal top.
This may not mean the main trend is turning down, but it could trigger the start of a 2 to 3 day break into a short-term 50% level.
Daily Technical Analysis
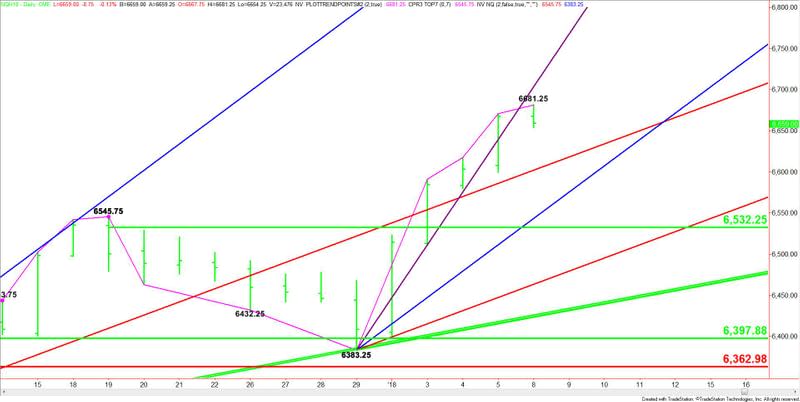
The main trend is up according to the daily swing chart. A trade through 6681.25 will signal a resumption of the uptrend. There is no resistance so a closing price reversal top will be the best sign that the selling is greater than the buying at current price levels.
The main range is 6383.25 to 6681.25. If there is a correction then its 50% level at 6532.25 will become the primary downside target.
Daily Technical Forecast
Based on the early trade, the direction of the index the rest of the session will be determined by trader reaction to Friday’s close at 6667.75.
A sustained move over 6667.75 will indicate the return of buyers. Taking out 6681.25 will indicate the buying is getting stronger. This could create the upside momentum needed to overtake the steep uptrending Gann angle at 6703.25.
A sustained move on the strong side of 6703.25 will put the index in an extremely bullish position.
A sustained move under 6667.75 will signal the presence of sellers. If this move picks up momentum then we could see an acceleration into a long-term uptrending Gann angle at 6601.75. This price is another trigger point for an acceleration into the steep uptrending Gann angle at 6543.25. This is followed closely by the 50% level at 6532.25.
A close under 6667.75 will form a closing price reversal bottom. This could lead to a 2 to 3 day correction.
This article was originally posted on FX Empire
