
 Yahoo Finance
 E-mini NASDAQ-100 Index (NQ) Futures Technical Analysis – Strengthens Over 8850.50, Weakens Under 8743.25
June E-mini NASDAQ-100 Index futures are trading sharply higher on Tuesday shortly after the cash market opening. The rally is being fueled by a strong recovery in oil prices and optimism that the reopening of a slew of countries and states could lead to a fast-recovery in the global economy.
At 14:10 GMT, June E-mini NASDAQ-100 Index are trading 8951.00, up 142.00 or +1.82%.
Gains in large technology and internet companies and oil prices are outweighing concerns about the latest U.S.-China spat and downbeat sentiment from the annual meeting of Warren Buffett’s Berkshire Hathaway.
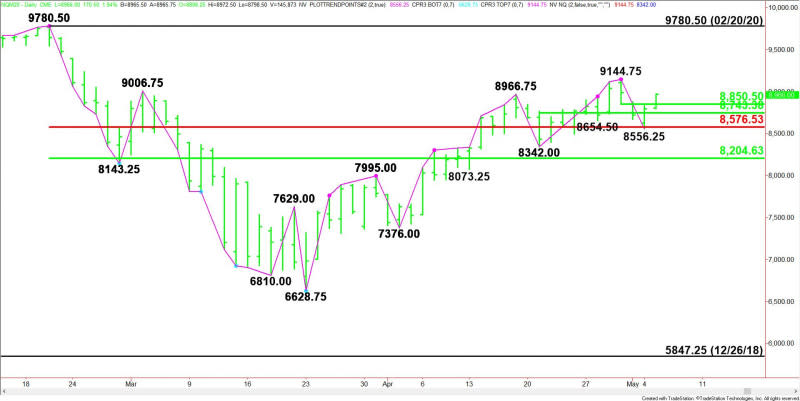
Daily Swing Chart Technical Analysis
The main trend is up according to the daily swing chart, however, momentum has been trending lower since the closing price reversal top on April 30.
A trade through 9144.75 will negate the closing price reversal top and signal a resumption of the uptrend. The main trend will change to down on a trade through the last swing bottom at 8342.00.
The main range is 9780.50 to 6628.75. Its retracement zone at 8576.50 to 8204.50 is controlling the longer-term direction of the index.
Additional support levels are a pair of 50% level at 8850.50 and 8743.25.
Daily Swing Chart Technical Forecast
Based on the early price action, the direction of the June E-mini NASDAQ-100 Index the rest of the session on Tuesday is likely to be determined by trader reaction to a minor pivot at 8850.50.
Bullish Scenario
A sustained move over 8850.50 will indicate the presence of buyers. This could trigger a surge into the main top at 9144.75 over the near-term.
Bearish Scenario
A sustained move under 8850.50 will signal the presence of sellers. If this creates enough downside momentum then look for a possible break into a potential support cluster at 8576.50 to 8556.25.
This article was originally posted on FX Empire
