
 Yahoo Finance
 E-mini NASDAQ-100 Index (NQ) Futures Technical Analysis – December 11, 2017 Forecast
March E-mini NASDAQ-100 Index futures are trading higher shortly after the opening. The index was trading higher during the pre-market session, but prices retreated after reports of an explosion in New York.
Daily Technical Analysis
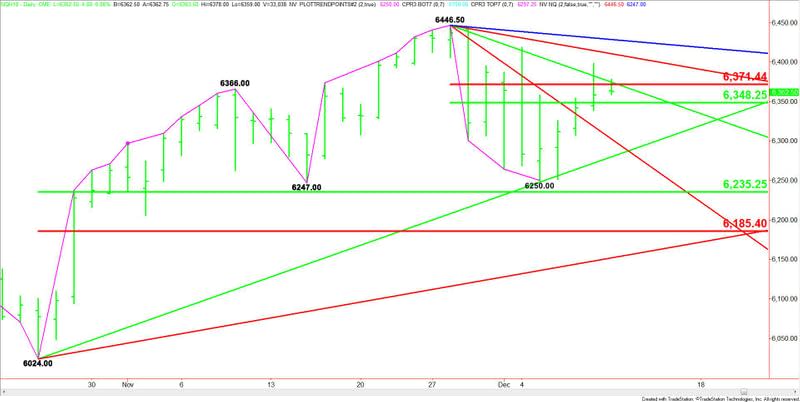
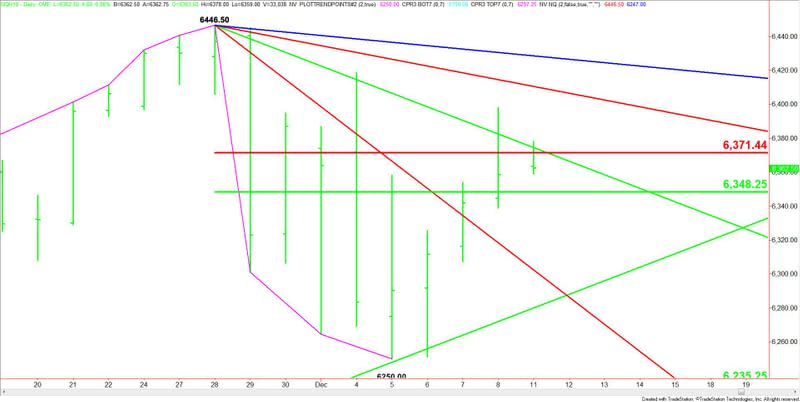
The main trend is up according to the daily swing chart. A trade through 6446.50 will signal a resumption of the uptrend. A move through 6250.00 will change the main trend to down.
The short-term range is 6446.50 to 6250.00. Its retracement zone is 6348.25 to 6371.50. This zone is acting like a pivot today.
Daily Technical Forecast
Based on the early trade, the direction of the index today is likely to be determined by trader reaction to the downtrending Gann angle at 6374.50.
A sustained move over 6374.50 will signal the presence of buyers. This could trigger a strong surge into the downtrending Gann angle at 6410.50, followed by another angle at 6428.50. The latter is the last potential resistance angle before the 6446.50 main top.
A sustained move under the Fibonacci level at 6371.50 will indicate the presence of sellers. This is followed by a 50% level at 6348.25. This price is the trigger point for an acceleration into a major uptrending Gann angle at 6280.50.
Basically, look for a bullish tone to develop on a sustained move over 6374.50 and for a bearish tone to develop on a sustained move under 6348.25.
This article was originally posted on FX Empire
