
 Yahoo Finance
 E-mini NASDAQ-100 Index (NQ) Futures Technical Analysis – Late Buyers May Be Forced to Liquidate
The December E-mini NASDAQ-100 Index failed to follow-through to the upside on Friday following Thursday’s strong surge to a new contract high. This price action suggests that perhaps the previous day’s attempt to breakout to the upside was fueled by short-covering and buy stops rather than new buying. Given the weak close, some traders who bought strength the previous day, may be trapped near the high. This could lead to intense selling if they are forced to liquidate their bad positions.
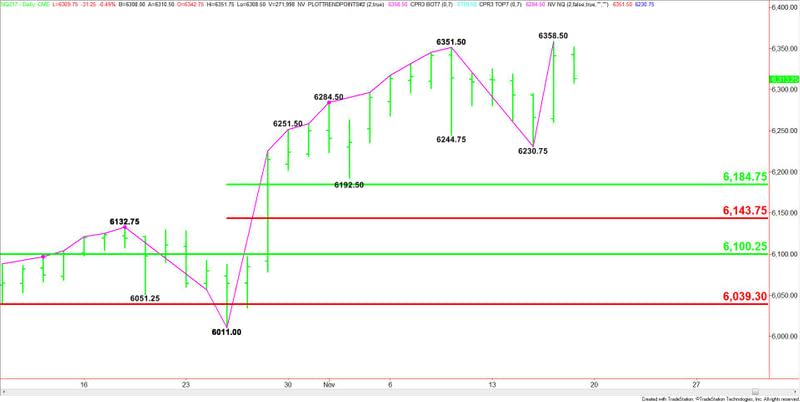
The main trend is up according to the daily swing chart. A trade through 6358.50 will signal a resumption of the uptrend. A move through 6230.75 will change the main trend to down.
Friday’s inside move suggests investor indecision and impending volatility. The indecision is probably being caused by worries over whether the U.S. tax reform bill will be signed into law before the end of the year. Investors are also concerned about the whether the Mueller probe into election improprieties will affect the Trump Administration’s ability to accomplish the President’s agenda.
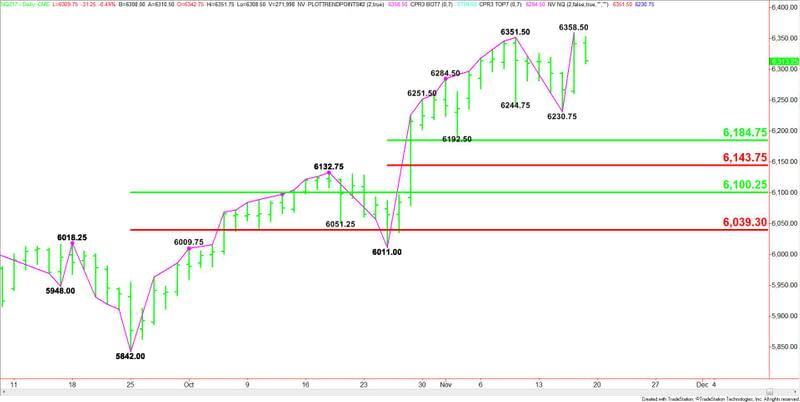
The short-term range is 6011.00 to 6358.50. If the trend changes to down then its retracement zone at 6184.75 to 6143.75 will become the initial downside target.
The main range is 5842.00 to 6358.50. If the selling pressure continues to build then its retracement zone at 6100.25 to 6039.25 will become the primary downside target.
According to the daily chart pattern, the direction of the index next week is likely to be determined by whether the buying comes in strong enough to sustain the higher-high, higher-low price action. In other words, buyers are going to have to continue to be willing to buy strength.
If sellers take control then the buyers trapped near the high are going to be forced to sell and this could lead to a change in trend to down.
This article was originally posted on FX Empire
More From FXEMPIRE:
Investors Shed Risky Assets on Concerns Over Tax Reform, Mueller Probe
S&P 500; US Indexes Fundamental Daily Forecast – Lack of Clarity Over Tax-Reform Creating Pressure
USD/JPY Price Forecast November 20, 2017, Technical Analysis
USD/CAD Price Forecast November 20, 2017, Technical Analysis
EUR/USD Price Forecast November 20, 2017, Technical Analysis
