
 Yahoo Finance
 E-mini NASDAQ-100 Index (NQ) Futures Technical Analysis – 8966.75 Next Upside Breakout Trigger Point
June E-mini NASDAQ-100 Index futures are trading at its high of the session shortly before the release of the U.S. Federal Reserve interest rate and monetary policy decisions at 18:00 GMT.
Technology shares jumped on Wednesday as Gilead Sciences gave an encouraging update on a potential COVID-19 treatment and upbeat earnings from Google-parent Alphabet boosted shares of other technology and internet giants.
At 17:00 GMT, June E-mini NASDAQ-100 Index futures are at 8946.25, up 226.50 or +2.60%.
NASDAQ components and growth stocks such as Facebook Inc, Amazon.com Inc and Netflix Inc gained between 2% and 6%, while Alphabet Inc surged 8.6% as its quarterly report showed Google ads steadied in April.
Daily Swing Chart Technical Analysis
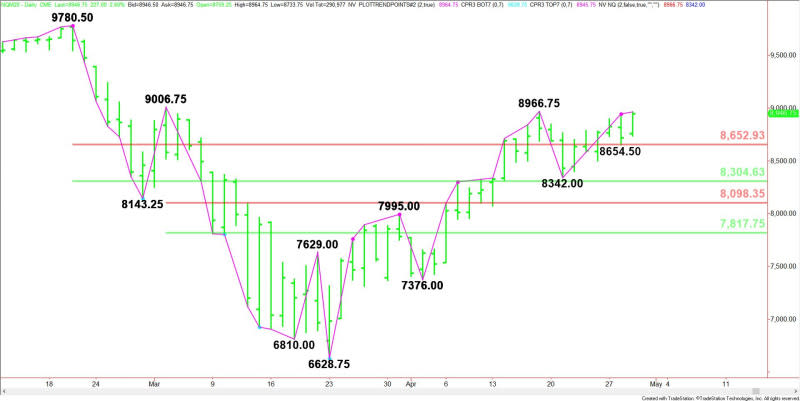
The main trend is up according to the daily swing chart. A trade through the last main top at 8966.75 will signal a resumption of the uptrend. The main trend will change to down on a move through the last main bottom at 8342.00.
The minor trend is also up. A trade through 8654.50 will change the minor trend to down. This will also shift momentum to the downside.
The main range is 9780.50 to 6628.75. Its retracement zone at 8653.00 to 8304.50 is major support. It’s also controlling the longer-term direction of the index. Holding above this area will help sustain the strong upside bias.
Daily Swing Chart Technical Forecast
Based on the early price action and the current price at 8946.25, the direction of the June E-min NASDAQ-100 Index into the close on Wednesday is likely to be determined by trader reaction to the main top at 8966.75.
Bullish Scenario
Taking out and sustaining a rally over 8966.75 will indicate the presence of buyers. If this generates enough upside momentum then look for the rally to possibly extend into the next main top at 9006.75. This price is a potential trigger point for an acceleration to the upside.
Bearish Scenario
A sustained move under 8966.75 will indicate the selling is greater than the buying at current price levels. Turning lower for the session will put the index in a position to form a potentially bearish closing price reversal top.
The first downside targets are 8654.50 and 8653.00. The latter is a potential trigger point for an acceleration to the downside.
This article was originally posted on FX Empire
More From FXEMPIRE:
S&P 500 Price Forecast – Stock Markets Shoot Straight Up In the Air Due to Drug Results
E-mini S&P 500 Index (ES) Futures Technical Analysis – Strong Over 2930.25, Weak Under 2867.25
Crude Oil Price Update – EIA Reports 9M Barrel Inventory Build – Lower than Expected
Natural Gas Price Prediction – Prices Drop Ahead of EIA Inventory Report
Crude Oil Price Forecast – Crude Oil Markets Shoot Straight Up In The Air
