
 Yahoo Finance
 E-mini NASDAQ-100 Index (NQ) Futures Technical Analysis – Trend Up, But Momentum Shifted to Downside
June E-mini NASDAQ-100 Index futures are trading lower late in the session on Wednesday after traders hit the technology sector amid caution about simmering tensions between the United States and China at a time when governments are attempting to revive the economies in the midst of a coronavirus-driven recession.
Amazon.com, Microsoft Corp. and Facebook, Inc., which have led a recent rally, weighed on the tech-heavy NASDAQ, while healthcare and technology stocks – which outperformed in the coronavirus-led market slump – were among the S&P 500 sector indexes in the red.
At 18:42 GMT, June E-mini NASDAQ-100 Index futures are trading 9287.50, down 119.00 or -1.27%.
On a positive note, travel-related stocks beaten up by the government shutdowns, including airlines, cruise companies and hotel operators jumped between 2.4% and 4.5% after taking a beating earlier this year due to a virtual halt in global travel.
Daily Swing Chart Technical Analysis
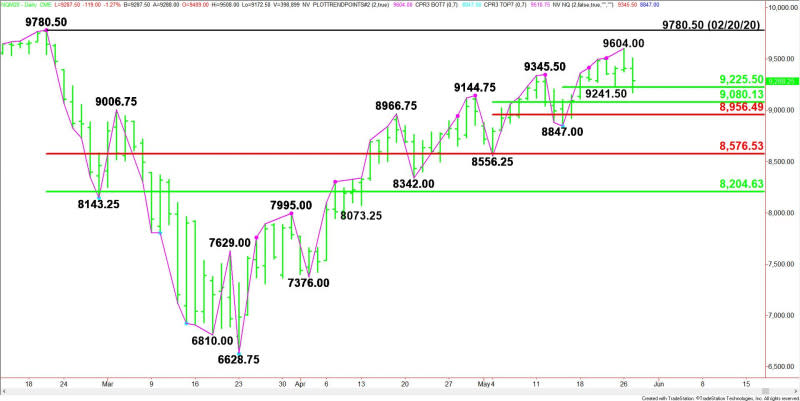
The main trend is up according to the daily swing chart, however, momentum shifted to the downside on Wednesday. A trade through 9604.00 will signal a resumption of the uptrend. The main trend will change to down on a move through the last swing bottom at 8847.00.
The minor trend is down. It turned down on Wednesday when sellers took out 9241.50. This move also shifted momentum to the downside.
The minor range is 8847.00 to 9604.00. Its 50% level at 9225.50 is controlling the price action on Wednesday.
The short-term range is 8556.25 to 9604.00. Its retracement zone at 9080.00 to 8956.50 is potential support. Since the main trend is up, buyers could come in on a test of this zone.
The main range is 9780.50 to 6628.75. Its retracement zone at 8576.50 to 8204.50 is controlling the longer-term direction of the index.
Daily Swing Chart Technical Forecast
Based on the early price action and the current price at 9287.50, the direction of the June E-mini NASDAQ-100 Index into the close on Wednesday is likely to be determined by trader reaction to 9225.50.
Bullish Scenario
A sustained move over 9225.50 late in the session will indicate the presence of buyers. This is followed by 9388.25 then 9604.00.
Bearish Scenario
A sustained move under 9225.00 will signal the presence of sellers. This could trigger a further break into the short-term retracement zone at 9080.00 to 8956.50.
For a look at all of today’s economic events, check out our economic calendar.
This article was originally posted on FX Empire
