
 Yahoo Finance
 E-mini S&P 500 Index (ES) Futures Technical Analysis – Weekly Chart Strength Over 2745.00, Weakness Under 2703.75
March E-mini S&P 500 Index futures settled higher last week after the previous week’s sharp break and high levels of volatility. Since reaching a low on February 6, the index has clawed back about 62% of the sell-off from the January 29 closing price reversal top on the daily and weekly charts.
Weekly Swing Chart Analysis
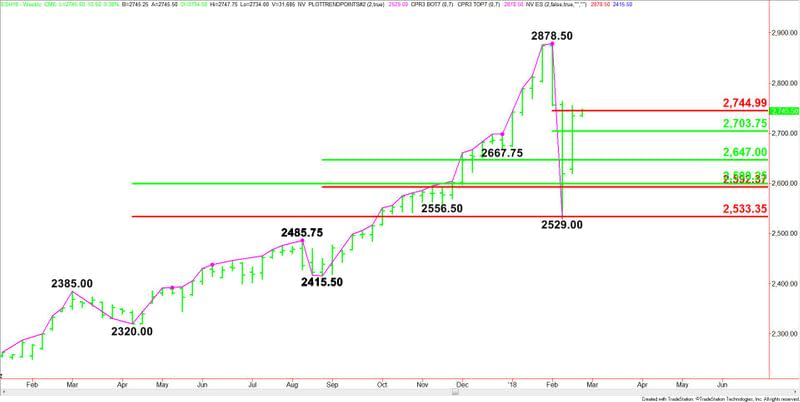
The main trend is up according to the weekly swing chart. However, momentum is trending lower since the formation of the closing price reversal top at 2878.50. A trade through this level will negate the chart pattern and signal a resumption of the uptrend.
A move through 2529.00 will indicate a resumption of the downtrend. This could trigger a possible break into the next main bottom at 2415.50.
Last week’s range fell inside the previous week’s range. This tends to indicate investor indecision and impending volatility.
The index is also being guided by a series of retracement levels.
The main range is 2320.00 to 2878.50. Its retracement zone is 2599.25 to 2533.25. This zone essentially stopped the break at 2529.00.
The intermediate range is 2415.50 to 2878.50. Its retracement zone is 2647.00 to 2592.25. This zone provided support last week.
The short-term range is 2878.50 to 2529.00. Its retracement zone is 2703.75 to 2745.00. This zone provide resistance last week and is currently being tested.
Weekly Swing Chart Forecast
Based on last week’s close at 2735.00 and price action, the direction of the index this week is likely to be determined by trader reaction to the short-term Fibonacci level at 2745.00.
A sustained move over 2745.00 will indicate the presence of buyers. This could create the upside momentum needed to eventually challenge the all-time high at 2878.50.
A sustained move under 2745.00 will signal the presence of sellers. This could quickly drive the index into 2703.75. This price is a potential trigger point for an acceleration into 2647.00.
The best downside target on the charts is the price cluster at 2599.25 to 2592.25. This is followed by 2533.25 to 2529.00.
The low at 2529.00 is the trigger point for an acceleration into at least 2415.50.
This article was originally posted on FX Empire
