
 Yahoo Finance
 E-mini S&P 500 Index (ES) Futures Technical Analysis – August 19, 2019 Forecast
September E-mini S&P 500 Index futures are expected to open sharply higher based on the pre-market trade. The rally is being fueled by a combination of events. One is firmer U.S. Treasury yields. They are rising on an easing of concerns over a U.S. recession after the release of stronger-than-expected retail sales data last week. Stocks are also being supported by signs of moves by Germany and China to counter slowing growth with aggressive stimulus.
At 13:18 GMT, September E-mini S&P 500 Index futures are trading 2924.00, up 32.50 or +1.12%.
Daily Technical Analysis
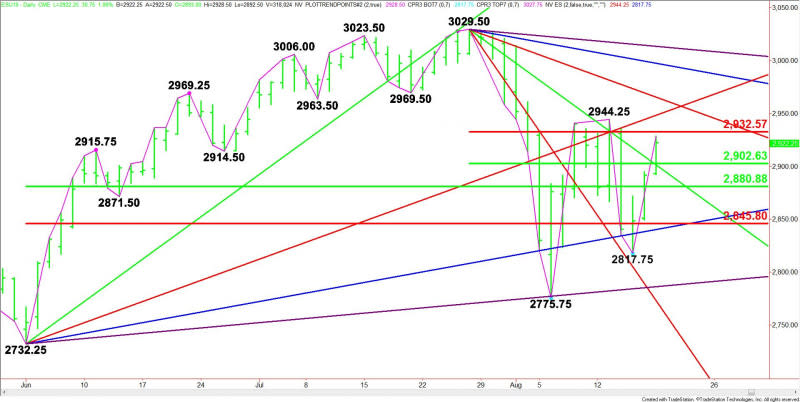
The main trend is down according to the daily swing chart, however, momentum is trending higher with the formation of a pair of closing price reversal bottoms at 2817.75 and 2775.75. The bottom at 2817.75 is also a short-term secondary higher bottom. The bottom at 2775.75 is a longer-term secondary higher bottom.
A trade through 2944.25 will change the main trend to up. A move through 2817.75 will signal a resumption of the downtrend.
The main range is 2732.25 to 3029.50. Its retracement zone at 2881.00 to 2845.75 is controlling the near-term direction of the index. It is currently support.
The short-term range is 3029.50 to 2775.75. Trader reaction to its retracement zone at 2902.50 to 2932.50 will determine whether the trend changes to up. The market is currently trading inside this zone.
Daily Technical Forecast
Based on the early price action, the direction of the September E-mini S&P 500 Index the rest of the session is likely to be determined by trader reaction to the short-term Fibonacci level at 2932.50.
Bullish Scenario
A sustained move over 2932.50 will indicate the presence of buyers. This could lead to a test of the main top at 2944.25.
Taking out 2044.25 will change the main trend to up. This could trigger a surge through an uptrending Gann angle at 2948.25, followed closely by a downtrending Gann angle at 2965.50. This is a potential trigger point for an acceleration into the downtrending Gann angle at 2997.50.
Bearish Scenario
A sustained move under 2932.50 will signal the return of sellers. This could lead to a retest of the support cluster at 2902.50 to 2901.50.
Crossing to the weak side of 2901.50 could lead to a further break into the main 50% level at 2881.00. If this price fails, we could see an acceleration into the main Fibonacci level at 2845.75.
This article was originally posted on FX Empire
