
 Yahoo Finance
 E-mini S&P 500 Index (ES) Futures Technical Analysis – Positive Headlines Feeding the Bull
September E-mini S&P 500 Index futures are screaming higher on Monday as investors cheered signs of progress in COVID-19 vaccine development and an upbeat start to the second-quarter earnings season by Pepsi Co.
Shares of German biotech firm BioNTech jumped 19.6% and Pfizer Inc climbed 4.2% as two of their experimental coronavirus vaccines received the U.S. FDA’s “fast track” designation.
PepsiCo Inc gained 2.2% as it benefited from a surge in at-home consumption of salty snacks such as Fritos and Cheetos during lockdowns.
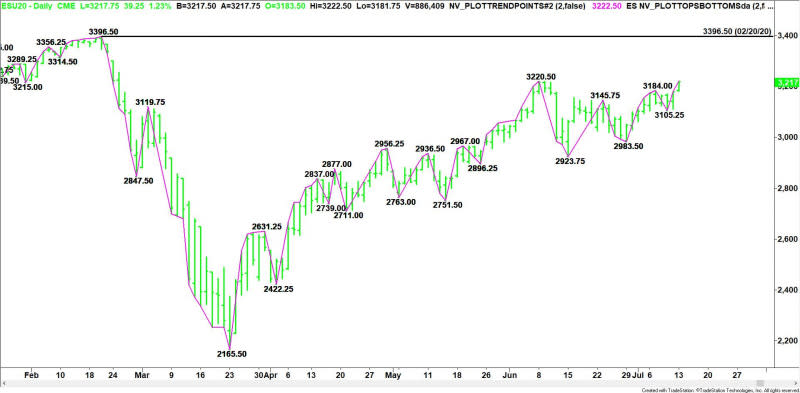
At 16:35 GMT, September E-mini S&P 500 Index futures are trading 3217.50, up 39.00 or 1.23%.
Daily Swing Chart Technical Analysis
The main trend is up according to the daily swing chart. The uptrend was reaffirmed earlier today when buyers took out the June 8 main top at 3220.50. A trade through 3105.25 will change the main trend to down.
Daily Swing Chart Technical Forecast
The current leg of the rally is being driven by headlines and momentum. This should continue during earnings season.
If buyers can sustain a rally over 3220.50 then they’ll start setting their sights on the February 20 all-time high at 3396.50.
A pullback under 3220.50 later in the session will be the first sign of weakness. Taking out 3178.50 will turn the index lower for the session and form a potentially bearish closing price reversal top. This won’t change the trend, but it could lead to a quick 2 to 3 day correction.
For a look at all of today’s economic events, check out our economic calendar.
This article was originally posted on FX Empire
More From FXEMPIRE:
PepsiCo Revenue Falls About 3% as COVID-19 Restrictions Bite; Target Price $150
GBP/JPY Price Forecast – British Pound Continues to Grind Sideways Against Yen
US Stock Market Overview – Stocks Rise Led by Materials; Technology Lags
E-mini S&P 500 Index (ES) Futures Technical Analysis – Positive Headlines Feeding the Bull
Natural Gas Price Forecast – Natural Gas Markets Continue to Find Support
