
 Yahoo Finance
 E-mini S&P 500 Index (ES) Futures Technical Analysis – Broad-based Weakness Ahead of CPI Report
September E-mini S&P 500 Index futures are trading lower late in the session on Thursday as investors grew cautious ahead of Friday’s U.S. consumer inflation report that is expected to show that consumer prices remained high in May.
All 11 of the S&P 500 sectors were in negative territory by afternoon, with the communication services sector down the most.
At 18:30 GMT, September E-mini S&P 500 Index futures are at 4055.25, down 60.75 or -1.48%. The S&P 500 Trust ETF (SPY) is trading $405.46, down $5.76 or -1.40%.
May CPI Expected to Rise
Friday’s US Consumer Price Index (CPI) report, due to be released at 12:30 GMT, is expected to show that consumer prices rose 0.7% in May, while the core CPI, which excludes the volatile food and energy sectors, rose 0.5% in the month.
US Jobless Claims Rise to Six-Month High
U.S. data on Thursday showed the labor market remains very tight, with weekly initial jobless claims rising to a seasonally adjusted 229,000 for the week ended June 4, the highest since mid-January, and above the 210,000 estimate.
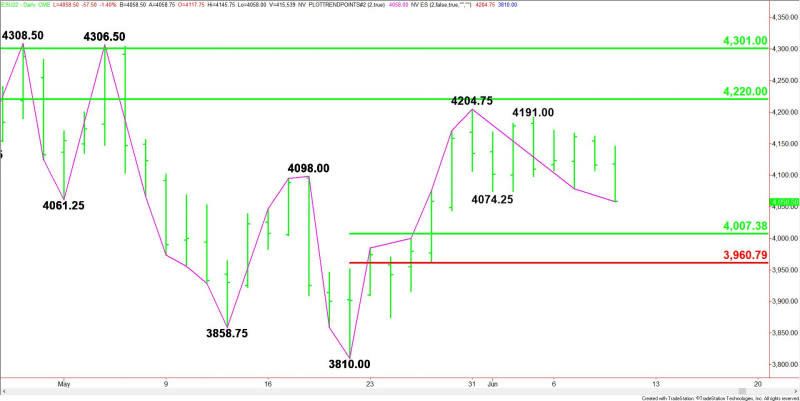
Daily Swing Chart Technical Analysis
The main trend is up according to the daily swing chart. However, momentum has been trending lower since the formation of the closing price reversal top on May 31.
A trade through 4204.75 will negate the potentially bearish chart pattern and signal a resumption of the uptrend. A move through 3810.00 will change the main trend to down.
The minor trend is down. It turned down when sellers took out 4074.25 earlier today. This confirmed the shift in momentum.
The short-term range is 3810.00 to 4204.75. Its retracement zone at 4007.25 to 3960.75 is the next downside target.
On the upside, resistance comes in at 4220.00.
Short-Term Outlook
Barring a late session short-covering rally, the index appears to be poised to challenge the short-term retracement zone at 4007.25 to 3960.75. Since the main trend is up, buyers could come in on a test of this area.
Taking out 3960.75 will be a sign of weakness and could trigger an acceleration to the downside with 3810.00 a potential downside target.
For a look at all of today’s economic events, check out our economic calendar.
This article was originally posted on FX Empire
