
 Yahoo Finance
 Earnings are growing at Berkeley Group Holdings (LON:BKG) but shareholders still don't like its prospects
Passive investing in an index fund is a good way to ensure your own returns roughly match the overall market. Active investors aim to buy stocks that vastly outperform the market - but in the process, they risk under-performance. For example, the The Berkeley Group Holdings plc (LON:BKG) share price is down 18% in the last year. That's well below the market decline of 2.9%. The silver lining (for longer term investors) is that the stock is still 6.0% higher than it was three years ago.
After losing 4.4% this past week, it's worth investigating the company's fundamentals to see what we can infer from past performance.
Check out our latest analysis for Berkeley Group Holdings
While markets are a powerful pricing mechanism, share prices reflect investor sentiment, not just underlying business performance. One way to examine how market sentiment has changed over time is to look at the interaction between a company's share price and its earnings per share (EPS).
Even though the Berkeley Group Holdings share price is down over the year, its EPS actually improved. Of course, the situation might betray previous over-optimism about growth.
The divergence between the EPS and the share price is quite notable, during the year. So it's well worth checking out some other metrics, too.
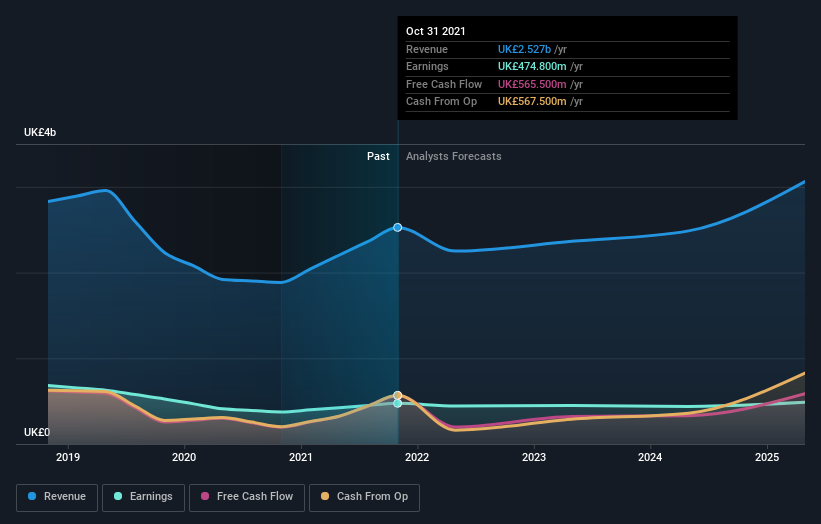
Berkeley Group Holdings' revenue is actually up 34% over the last year. Since we can't easily explain the share price movement based on these metrics, it might be worth considering how market sentiment has changed towards the stock.
The image below shows how earnings and revenue have tracked over time (if you click on the image you can see greater detail).
We consider it positive that insiders have made significant purchases in the last year. Having said that, most people consider earnings and revenue growth trends to be a more meaningful guide to the business. So we recommend checking out this free report showing consensus forecasts
What about the Total Shareholder Return (TSR)?
Investors should note that there's a difference between Berkeley Group Holdings' total shareholder return (TSR) and its share price change, which we've covered above. Arguably the TSR is a more complete return calculation because it accounts for the value of dividends (as if they were reinvested), along with the hypothetical value of any discounted capital that have been offered to shareholders. Berkeley Group Holdings' TSR of was a loss of 11% for the 1 year. That wasn't as bad as its share price return, because it has paid dividends.
A Different Perspective
While the broader market lost about 2.9% in the twelve months, Berkeley Group Holdings shareholders did even worse, losing 11%. However, it could simply be that the share price has been impacted by broader market jitters. It might be worth keeping an eye on the fundamentals, in case there's a good opportunity. On the bright side, long term shareholders have made money, with a gain of 7% per year over half a decade. It could be that the recent sell-off is an opportunity, so it may be worth checking the fundamental data for signs of a long term growth trend. Investors who like to make money usually check up on insider purchases, such as the price paid, and total amount bought. You can find out about the insider purchases of Berkeley Group Holdings by clicking this link.
If you like to buy stocks alongside management, then you might just love this free list of companies. (Hint: insiders have been buying them).
Please note, the market returns quoted in this article reflect the market weighted average returns of stocks that currently trade on GB exchanges.
Have feedback on this article? Concerned about the content? Get in touch with us directly. Alternatively, email editorial-team (at) simplywallst.com.
This article by Simply Wall St is general in nature. We provide commentary based on historical data and analyst forecasts only using an unbiased methodology and our articles are not intended to be financial advice. It does not constitute a recommendation to buy or sell any stock, and does not take account of your objectives, or your financial situation. We aim to bring you long-term focused analysis driven by fundamental data. Note that our analysis may not factor in the latest price-sensitive company announcements or qualitative material. Simply Wall St has no position in any stocks mentioned.
