
 Yahoo Finance
 Earnings growth of 18% over 3 years hasn't been enough to translate into positive returns for ManpowerGroup (NYSE:MAN) shareholders
Many investors define successful investing as beating the market average over the long term. But in any portfolio, there are likely to be some stocks that fall short of that benchmark. We regret to report that long term ManpowerGroup Inc. (NYSE:MAN) shareholders have had that experience, with the share price dropping 35% in three years, versus a market return of about 17%.
After losing 5.7% this past week, it's worth investigating the company's fundamentals to see what we can infer from past performance.
Check out our latest analysis for ManpowerGroup
While the efficient markets hypothesis continues to be taught by some, it has been proven that markets are over-reactive dynamic systems, and investors are not always rational. By comparing earnings per share (EPS) and share price changes over time, we can get a feel for how investor attitudes to a company have morphed over time.
During the unfortunate three years of share price decline, ManpowerGroup actually saw its earnings per share (EPS) improve by 65% per year. Given the share price reaction, one might suspect that EPS is not a good guide to the business performance during the period (perhaps due to a one-off loss or gain). Alternatively, growth expectations may have been unreasonable in the past.
It's worth taking a look at other metrics, because the EPS growth doesn't seem to match with the falling share price.
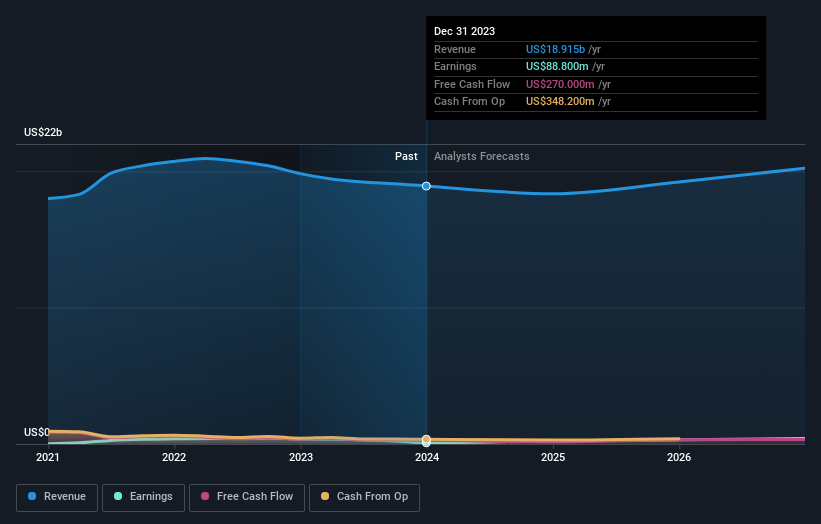
Given the healthiness of the dividend payments, we doubt that they've concerned the market. Revenue has been pretty flat over three years, so that isn't an obvious reason shareholders would sell. A closer look at revenue and profit trends might yield insights.
The company's revenue and earnings (over time) are depicted in the image below (click to see the exact numbers).
ManpowerGroup is a well known stock, with plenty of analyst coverage, suggesting some visibility into future growth. Given we have quite a good number of analyst forecasts, it might be well worth checking out this free chart depicting consensus estimates.
What About Dividends?
It is important to consider the total shareholder return, as well as the share price return, for any given stock. Whereas the share price return only reflects the change in the share price, the TSR includes the value of dividends (assuming they were reinvested) and the benefit of any discounted capital raising or spin-off. Arguably, the TSR gives a more comprehensive picture of the return generated by a stock. We note that for ManpowerGroup the TSR over the last 3 years was -28%, which is better than the share price return mentioned above. This is largely a result of its dividend payments!
A Different Perspective
ManpowerGroup shareholders are down 8.1% for the year (even including dividends), but the market itself is up 25%. Even the share prices of good stocks drop sometimes, but we want to see improvements in the fundamental metrics of a business, before getting too interested. Unfortunately, last year's performance may indicate unresolved challenges, given that it was worse than the annualised loss of 3% over the last half decade. Generally speaking long term share price weakness can be a bad sign, though contrarian investors might want to research the stock in hope of a turnaround. I find it very interesting to look at share price over the long term as a proxy for business performance. But to truly gain insight, we need to consider other information, too. Consider for instance, the ever-present spectre of investment risk. We've identified 3 warning signs with ManpowerGroup , and understanding them should be part of your investment process.
Of course ManpowerGroup may not be the best stock to buy. So you may wish to see this free collection of growth stocks.
Please note, the market returns quoted in this article reflect the market weighted average returns of stocks that currently trade on American exchanges.
Have feedback on this article? Concerned about the content? Get in touch with us directly. Alternatively, email editorial-team (at) simplywallst.com.
This article by Simply Wall St is general in nature. We provide commentary based on historical data and analyst forecasts only using an unbiased methodology and our articles are not intended to be financial advice. It does not constitute a recommendation to buy or sell any stock, and does not take account of your objectives, or your financial situation. We aim to bring you long-term focused analysis driven by fundamental data. Note that our analysis may not factor in the latest price-sensitive company announcements or qualitative material. Simply Wall St has no position in any stocks mentioned.
