
 Yahoo Finance
 Earnings growth of 6.9% over 1 year hasn't been enough to translate into positive returns for BlackRock (NYSE:BLK) shareholders
Passive investing in an index fund is a good way to ensure your own returns roughly match the overall market. But if you buy individual stocks, you can do both better or worse than that. Investors in BlackRock, Inc. (NYSE:BLK) have tasted that bitter downside in the last year, as the share price dropped 35%. That contrasts poorly with the market decline of 22%. On the other hand, the stock is actually up 29% over three years. Even worse, it's down 17% in about a month, which isn't fun at all. We do note, however, that the broader market is down 9.6% in that period, and this may have weighed on the share price.
If the past week is anything to go by, investor sentiment for BlackRock isn't positive, so let's see if there's a mismatch between fundamentals and the share price.
Check out our latest analysis for BlackRock
There is no denying that markets are sometimes efficient, but prices do not always reflect underlying business performance. One way to examine how market sentiment has changed over time is to look at the interaction between a company's share price and its earnings per share (EPS).
Even though the BlackRock share price is down over the year, its EPS actually improved. Of course, the situation might betray previous over-optimism about growth.
It's fair to say that the share price does not seem to be reflecting the EPS growth. But we might find some different metrics explain the share price movements better.
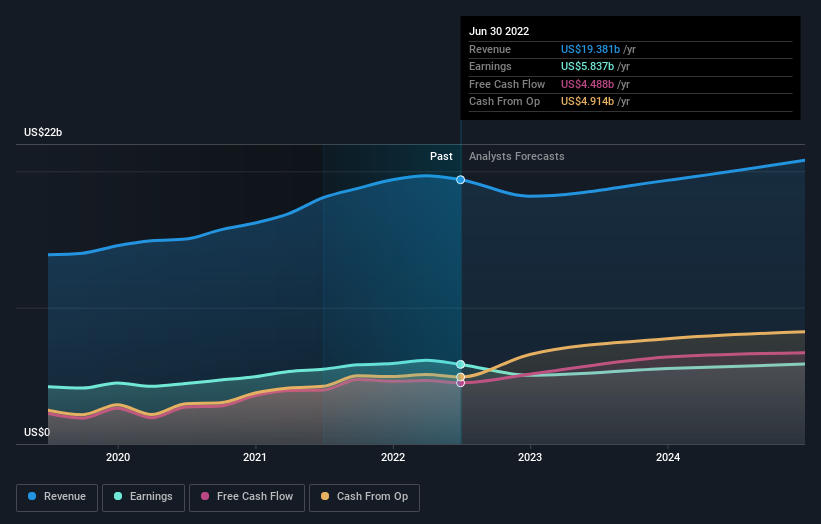
BlackRock managed to grow revenue over the last year, which is usually a real positive. Since the fundamental metrics don't readily explain the share price drop, there might be an opportunity if the market has overreacted.
You can see how earnings and revenue have changed over time in the image below (click on the chart to see the exact values).
We like that insiders have been buying shares in the last twelve months. Even so, future earnings will be far more important to whether current shareholders make money. So we recommend checking out this free report showing consensus forecasts
A Different Perspective
We regret to report that BlackRock shareholders are down 33% for the year (even including dividends). Unfortunately, that's worse than the broader market decline of 22%. However, it could simply be that the share price has been impacted by broader market jitters. It might be worth keeping an eye on the fundamentals, in case there's a good opportunity. Longer term investors wouldn't be so upset, since they would have made 6%, each year, over five years. It could be that the recent sell-off is an opportunity, so it may be worth checking the fundamental data for signs of a long term growth trend. It's always interesting to track share price performance over the longer term. But to understand BlackRock better, we need to consider many other factors. For instance, we've identified 1 warning sign for BlackRock that you should be aware of.
There are plenty of other companies that have insiders buying up shares. You probably do not want to miss this free list of growing companies that insiders are buying.
Please note, the market returns quoted in this article reflect the market weighted average returns of stocks that currently trade on US exchanges.
Have feedback on this article? Concerned about the content? Get in touch with us directly. Alternatively, email editorial-team (at) simplywallst.com.
This article by Simply Wall St is general in nature. We provide commentary based on historical data and analyst forecasts only using an unbiased methodology and our articles are not intended to be financial advice. It does not constitute a recommendation to buy or sell any stock, and does not take account of your objectives, or your financial situation. We aim to bring you long-term focused analysis driven by fundamental data. Note that our analysis may not factor in the latest price-sensitive company announcements or qualitative material. Simply Wall St has no position in any stocks mentioned.
Join A Paid User Research Session
You’ll receive a US$30 Amazon Gift card for 1 hour of your time while helping us build better investing tools for the individual investors like yourself. Sign up here
