
 Yahoo Finance
 Earnings growth outpaced the favorable 40% return delivered to HeadHunter Group (NASDAQ:HHR) shareholders over the last year
HeadHunter Group PLC (NASDAQ:HHR) shareholders might be concerned after seeing the share price drop 20% in the last quarter. But that doesn't change the reality that over twelve months the stock has done really well. After all, the share price is up a market-beating 35% in that time.
The past week has proven to be lucrative for HeadHunter Group investors, so let's see if fundamentals drove the company's one-year performance.
See our latest analysis for HeadHunter Group
There is no denying that markets are sometimes efficient, but prices do not always reflect underlying business performance. By comparing earnings per share (EPS) and share price changes over time, we can get a feel for how investor attitudes to a company have morphed over time.
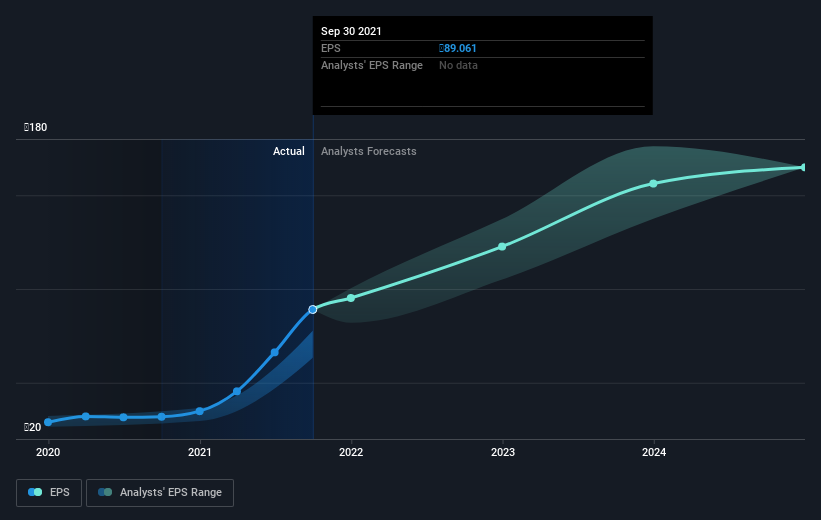
HeadHunter Group was able to grow EPS by 179% in the last twelve months. This EPS growth is significantly higher than the 35% increase in the share price. So it seems like the market has cooled on HeadHunter Group, despite the growth. Interesting.
You can see how EPS has changed over time in the image below (click on the chart to see the exact values).
We know that HeadHunter Group has improved its bottom line over the last three years, but what does the future have in store? This free interactive report on HeadHunter Group's balance sheet strength is a great place to start, if you want to investigate the stock further.
What About Dividends?
When looking at investment returns, it is important to consider the difference between total shareholder return (TSR) and share price return. The TSR is a return calculation that accounts for the value of cash dividends (assuming that any dividend received was reinvested) and the calculated value of any discounted capital raisings and spin-offs. It's fair to say that the TSR gives a more complete picture for stocks that pay a dividend. In the case of HeadHunter Group, it has a TSR of 40% for the last 1 year. That exceeds its share price return that we previously mentioned. This is largely a result of its dividend payments!
A Different Perspective
HeadHunter Group boasts a total shareholder return of 40% for the last year (that includes the dividends) . Unfortunately the share price is down 20% over the last quarter. It may simply be that the share price got ahead of itself, although there may have been fundamental developments that are weighing on it. I find it very interesting to look at share price over the long term as a proxy for business performance. But to truly gain insight, we need to consider other information, too. Case in point: We've spotted 3 warning signs for HeadHunter Group you should be aware of.
If you like to buy stocks alongside management, then you might just love this free list of companies. (Hint: insiders have been buying them).
Please note, the market returns quoted in this article reflect the market weighted average returns of stocks that currently trade on US exchanges.
Have feedback on this article? Concerned about the content? Get in touch with us directly. Alternatively, email editorial-team (at) simplywallst.com.
This article by Simply Wall St is general in nature. We provide commentary based on historical data and analyst forecasts only using an unbiased methodology and our articles are not intended to be financial advice. It does not constitute a recommendation to buy or sell any stock, and does not take account of your objectives, or your financial situation. We aim to bring you long-term focused analysis driven by fundamental data. Note that our analysis may not factor in the latest price-sensitive company announcements or qualitative material. Simply Wall St has no position in any stocks mentioned.
