
 Yahoo Finance
 Earnings growth outpaced the massive 458% return delivered to Abercrombie & Fitch (NYSE:ANF) shareholders over the last year
For many, the main point of investing in the stock market is to achieve spectacular returns. While not every stock performs well, when investors win, they can win big. In the case of Abercrombie & Fitch Co. (NYSE:ANF), the share price is up an incredible 458% in the last year alone. Also pleasing for shareholders was the 48% gain in the last three months. This could be related to the recent financial results, released recently - you can catch up on the most recent data by reading our company report. It is also impressive that the stock is up 318% over three years, adding to the sense that it is a real winner.
The past week has proven to be lucrative for Abercrombie & Fitch investors, so let's see if fundamentals drove the company's one-year performance.
See our latest analysis for Abercrombie & Fitch
To paraphrase Benjamin Graham: Over the short term the market is a voting machine, but over the long term it's a weighing machine. One imperfect but simple way to consider how the market perception of a company has shifted is to compare the change in the earnings per share (EPS) with the share price movement.
Abercrombie & Fitch boasted truly magnificent EPS growth in the last year. We don't think the exact number is a good guide to the sustainable growth rate, but we do think this sort of increase is impressive. We are not surprised the share price is up. To us, inflection points like this are the best time to take a close look at a stock.
The graphic below depicts how EPS has changed over time (unveil the exact values by clicking on the image).
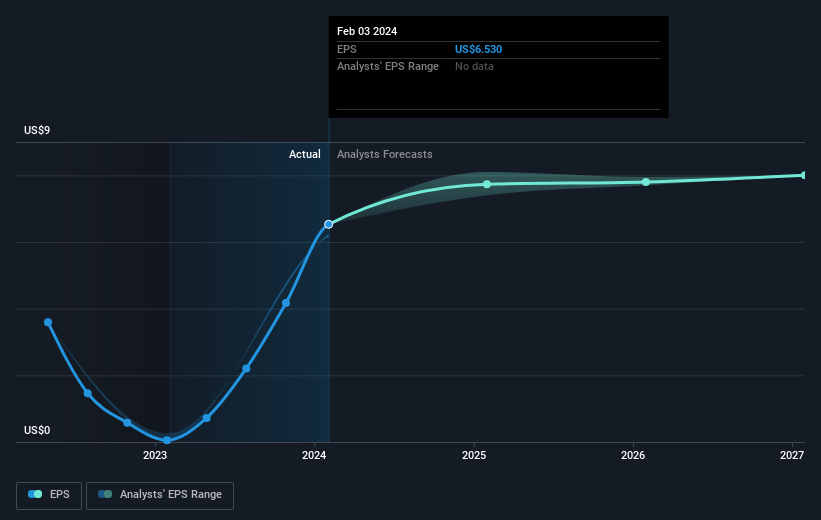
We know that Abercrombie & Fitch has improved its bottom line lately, but is it going to grow revenue? This free report showing analyst revenue forecasts should help you figure out if the EPS growth can be sustained.
A Different Perspective
We're pleased to report that Abercrombie & Fitch shareholders have received a total shareholder return of 458% over one year. That's better than the annualised return of 40% over half a decade, implying that the company is doing better recently. Given the share price momentum remains strong, it might be worth taking a closer look at the stock, lest you miss an opportunity. I find it very interesting to look at share price over the long term as a proxy for business performance. But to truly gain insight, we need to consider other information, too. Consider risks, for instance. Every company has them, and we've spotted 2 warning signs for Abercrombie & Fitch you should know about.
If you would prefer to check out another company -- one with potentially superior financials -- then do not miss this free list of companies that have proven they can grow earnings.
Please note, the market returns quoted in this article reflect the market weighted average returns of stocks that currently trade on American exchanges.
Have feedback on this article? Concerned about the content? Get in touch with us directly. Alternatively, email editorial-team (at) simplywallst.com.
This article by Simply Wall St is general in nature. We provide commentary based on historical data and analyst forecasts only using an unbiased methodology and our articles are not intended to be financial advice. It does not constitute a recommendation to buy or sell any stock, and does not take account of your objectives, or your financial situation. We aim to bring you long-term focused analysis driven by fundamental data. Note that our analysis may not factor in the latest price-sensitive company announcements or qualitative material. Simply Wall St has no position in any stocks mentioned.
