
 Yahoo Finance
 Earnings growth outpaced the notable 10% CAGR delivered to Drax Group (LON:DRX) shareholders over the last five years
When we invest, we're generally looking for stocks that outperform the market average. And while active stock picking involves risks (and requires diversification) it can also provide excess returns. To wit, the Drax Group share price has climbed 30% in five years, easily topping the market return of 1.7% (ignoring dividends).
After a strong gain in the past week, it's worth seeing if longer term returns have been driven by improving fundamentals.
Check out our latest analysis for Drax Group
While the efficient markets hypothesis continues to be taught by some, it has been proven that markets are over-reactive dynamic systems, and investors are not always rational. One way to examine how market sentiment has changed over time is to look at the interaction between a company's share price and its earnings per share (EPS).
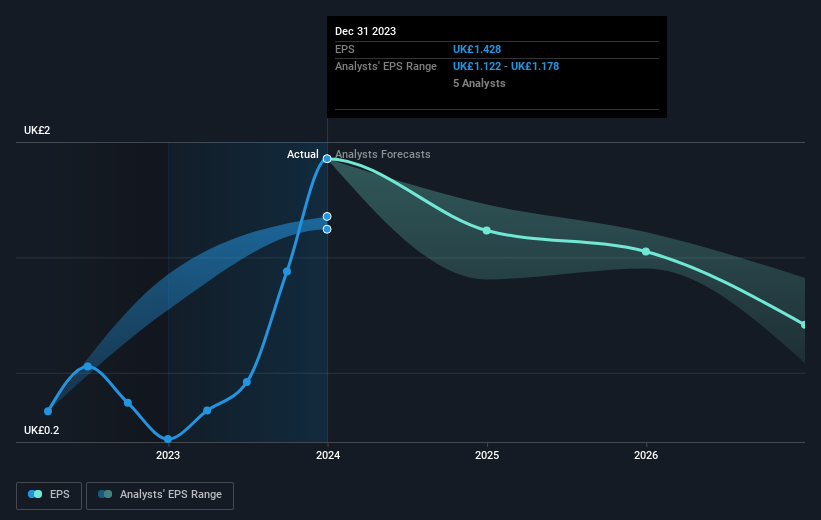
During the last half decade, Drax Group became profitable. That's generally thought to be a genuine positive, so investors may expect to see an increasing share price.
You can see how EPS has changed over time in the image below (click on the chart to see the exact values).
We consider it positive that insiders have made significant purchases in the last year. Even so, future earnings will be far more important to whether current shareholders make money. It might be well worthwhile taking a look at our free report on Drax Group's earnings, revenue and cash flow.
What About Dividends?
As well as measuring the share price return, investors should also consider the total shareholder return (TSR). Whereas the share price return only reflects the change in the share price, the TSR includes the value of dividends (assuming they were reinvested) and the benefit of any discounted capital raising or spin-off. Arguably, the TSR gives a more comprehensive picture of the return generated by a stock. As it happens, Drax Group's TSR for the last 5 years was 61%, which exceeds the share price return mentioned earlier. And there's no prize for guessing that the dividend payments largely explain the divergence!
A Different Perspective
Investors in Drax Group had a tough year, with a total loss of 14% (including dividends), against a market gain of about 6.7%. However, keep in mind that even the best stocks will sometimes underperform the market over a twelve month period. On the bright side, long term shareholders have made money, with a gain of 10% per year over half a decade. It could be that the recent sell-off is an opportunity, so it may be worth checking the fundamental data for signs of a long term growth trend. It's always interesting to track share price performance over the longer term. But to understand Drax Group better, we need to consider many other factors. Even so, be aware that Drax Group is showing 3 warning signs in our investment analysis , and 1 of those shouldn't be ignored...
Drax Group is not the only stock that insiders are buying. For those who like to find winning investments this free list of growing companies with recent insider purchasing, could be just the ticket.
Please note, the market returns quoted in this article reflect the market weighted average returns of stocks that currently trade on British exchanges.
Have feedback on this article? Concerned about the content? Get in touch with us directly. Alternatively, email editorial-team (at) simplywallst.com.
This article by Simply Wall St is general in nature. We provide commentary based on historical data and analyst forecasts only using an unbiased methodology and our articles are not intended to be financial advice. It does not constitute a recommendation to buy or sell any stock, and does not take account of your objectives, or your financial situation. We aim to bring you long-term focused analysis driven by fundamental data. Note that our analysis may not factor in the latest price-sensitive company announcements or qualitative material. Simply Wall St has no position in any stocks mentioned.
