
 Yahoo Finance
 Are Eddie Stobart Logistics plc’s (LON:ESL) Interest Costs Too High?

Investors are always looking for growth in small-cap stocks like Eddie Stobart Logistics plc (LON:ESL), with a market cap of UK£489.1m. However, an important fact which most ignore is: how financially healthy is the business? Evaluating financial health as part of your investment thesis is essential, as mismanagement of capital can lead to bankruptcies, which occur at a higher rate for small-caps. Here are a few basic checks that are good enough to have a broad overview of the company’s financial strength. However, given that I have not delve into the company-specifics, I’d encourage you to dig deeper yourself into ESL here.
How does ESL’s operating cash flow stack up against its debt?
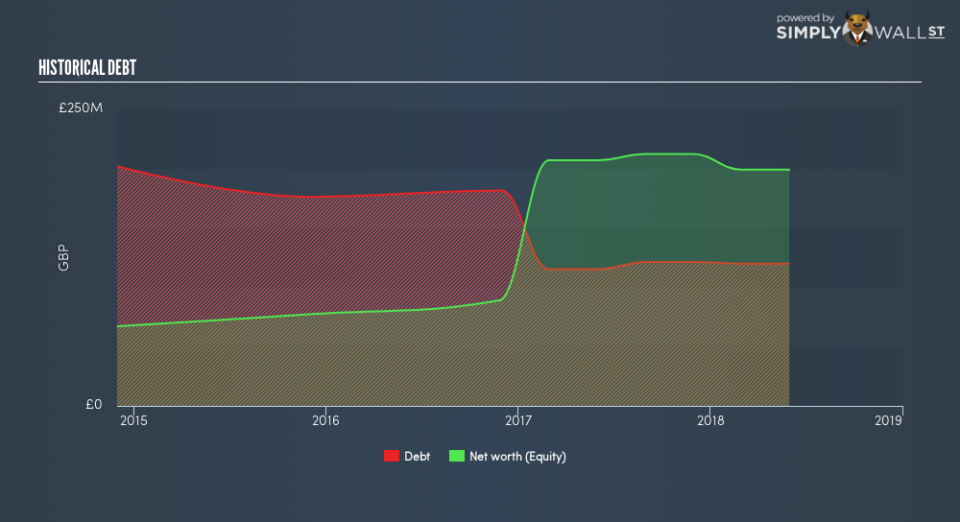
Over the past year, ESL has maintained its debt levels at around UK£119.9m comprising of short- and long-term debt. At this stable level of debt, ESL’s cash and short-term investments stands at UK£5.7m , ready to deploy into the business. Additionally, ESL has generated cash from operations of UK£14.2m during the same period of time, leading to an operating cash to total debt ratio of 11.8%, indicating that ESL’s debt is not appropriately covered by operating cash. This ratio can also be a sign of operational efficiency as an alternative to return on assets. In ESL’s case, it is able to generate 0.12x cash from its debt capital.
Does ESL’s liquid assets cover its short-term commitments?
At the current liabilities level of UK£173.5m liabilities, it appears that the company has maintained a safe level of current assets to meet its obligations, with the current ratio last standing at 1.05x. For Transportation companies, this ratio is within a sensible range as there’s enough of a cash buffer without holding too capital in low return investments.
Can ESL service its debt comfortably?
With debt reaching 60.2% of equity, ESL may be thought of as relatively highly levered. This is not unusual for small-caps as debt tends to be a cheaper and faster source of funding for some businesses. We can check to see whether ESL is able to meet its debt obligations by looking at the net interest coverage ratio. A company generating earnings before interest and tax (EBIT) at least three times its net interest payments is considered financially sound. In ESL’s, case, the ratio of 7.86x suggests that interest is appropriately covered, which means that debtors may be willing to loan the company more money, giving ESL ample headroom to grow its debt facilities.
Next Steps:
At its current level of cash flow coverage, ESL has room for improvement to better cushion for events which may require debt repayment. However, the company will be able to pay all of its upcoming liabilities from its current short-term assets. I admit this is a fairly basic analysis for ESL’s financial health. Other important fundamentals need to be considered alongside. I suggest you continue to research Eddie Stobart Logistics to get a more holistic view of the stock by looking at:
Future Outlook: What are well-informed industry analysts predicting for ESL’s future growth? Take a look at our free research report of analyst consensus for ESL’s outlook.
Valuation: What is ESL worth today? Is the stock undervalued, even when its growth outlook is factored into its intrinsic value? The intrinsic value infographic in our free research report helps visualize whether ESL is currently mispriced by the market.
Other High-Performing Stocks: Are there other stocks that provide better prospects with proven track records? Explore our free list of these great stocks here.
To help readers see past the short term volatility of the financial market, we aim to bring you a long-term focused research analysis purely driven by fundamental data. Note that our analysis does not factor in the latest price-sensitive company announcements.
The author is an independent contributor and at the time of publication had no position in the stocks mentioned. For errors that warrant correction please contact the editor at editorial-team@simplywallst.com.
