
 Yahoo Finance
 Egdon Resources (LON:EDR) Is Doing The Right Things To Multiply Its Share Price
If you're not sure where to start when looking for the next multi-bagger, there are a few key trends you should keep an eye out for. One common approach is to try and find a company with returns on capital employed (ROCE) that are increasing, in conjunction with a growing amount of capital employed. Ultimately, this demonstrates that it's a business that is reinvesting profits at increasing rates of return. Speaking of which, we noticed some great changes in Egdon Resources' (LON:EDR) returns on capital, so let's have a look.
Understanding Return On Capital Employed (ROCE)
For those that aren't sure what ROCE is, it measures the amount of pre-tax profits a company can generate from the capital employed in its business. The formula for this calculation on Egdon Resources is:
Return on Capital Employed = Earnings Before Interest and Tax (EBIT) ÷ (Total Assets - Current Liabilities)
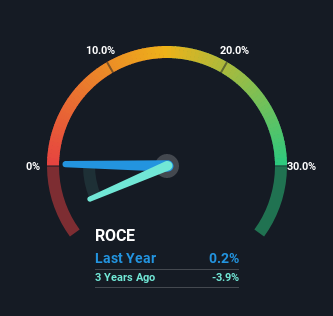
0.0017 = UK£53k ÷ (UK£34m - UK£2.9m) (Based on the trailing twelve months to January 2022).
Thus, Egdon Resources has an ROCE of 0.2%. In absolute terms, that's a low return and it also under-performs the Oil and Gas industry average of 6.0%.
See our latest analysis for Egdon Resources
In the above chart we have measured Egdon Resources' prior ROCE against its prior performance, but the future is arguably more important. If you're interested, you can view the analysts predictions in our free report on analyst forecasts for the company.
What Can We Tell From Egdon Resources' ROCE Trend?
We're delighted to see that Egdon Resources is reaping rewards from its investments and has now broken into profitability. The company was generating losses five years ago, but has managed to turn it around and as we saw earlier is now earning 0.2%, which is always encouraging. On top of that, what's interesting is that the amount of capital being employed has remained steady, so the business hasn't needed to put any additional money to work to generate these higher returns. That being said, while an increase in efficiency is no doubt appealing, it'd be helpful to know if the company does have any investment plans going forward. Because in the end, a business can only get so efficient.
The Bottom Line
To bring it all together, Egdon Resources has done well to increase the returns it's generating from its capital employed. And since the stock has fallen 63% over the last five years, there might be an opportunity here. With that in mind, we believe the promising trends warrant this stock for further investigation.
Since virtually every company faces some risks, it's worth knowing what they are, and we've spotted 5 warning signs for Egdon Resources (of which 1 makes us a bit uncomfortable!) that you should know about.
If you want to search for solid companies with great earnings, check out this free list of companies with good balance sheets and impressive returns on equity.
Have feedback on this article? Concerned about the content? Get in touch with us directly. Alternatively, email editorial-team (at) simplywallst.com.
This article by Simply Wall St is general in nature. We provide commentary based on historical data and analyst forecasts only using an unbiased methodology and our articles are not intended to be financial advice. It does not constitute a recommendation to buy or sell any stock, and does not take account of your objectives, or your financial situation. We aim to bring you long-term focused analysis driven by fundamental data. Note that our analysis may not factor in the latest price-sensitive company announcements or qualitative material. Simply Wall St has no position in any stocks mentioned.
