
 Yahoo Finance
 Ei Group plc (LON:EIG): Time For A Financial Health Check

While small-cap stocks, such as Ei Group plc (LON:EIG) with its market cap of UK£683.44m, are popular for their explosive growth, investors should also be aware of their balance sheet to judge whether the company can survive a downturn. Evaluating financial health as part of your investment thesis is vital, since poor capital management may bring about bankruptcies, which occur at a higher rate for small-caps. I believe these basic checks tell most of the story you need to know. However, given that I have not delve into the company-specifics, I’d encourage you to dig deeper yourself into EIG here.
How does EIG’s operating cash flow stack up against its debt?
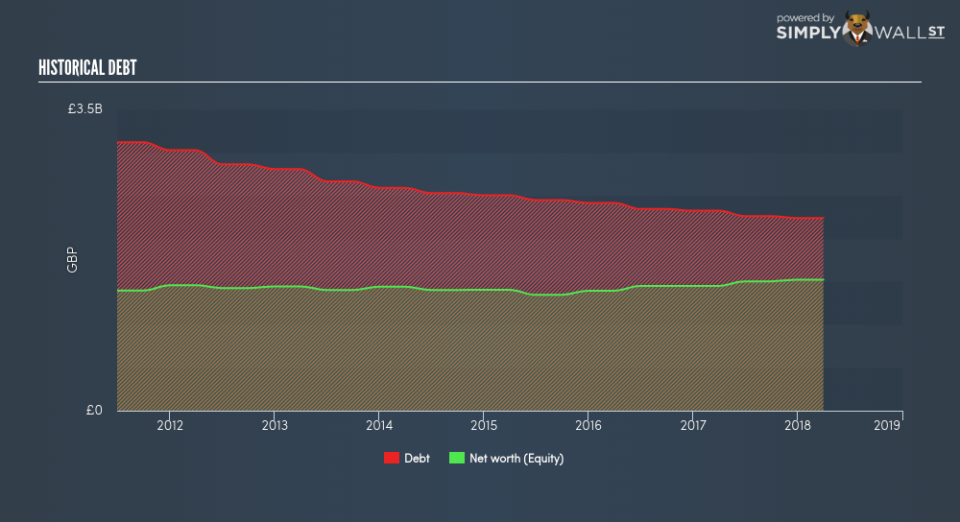
EIG’s debt level has been constant at around UK£2.26b over the previous year made up of current and long term debt. At this constant level of debt, the current cash and short-term investment levels stands at UK£151.00m for investing into the business. Moreover, EIG has generated cash from operations of UK£261.00m during the same period of time, resulting in an operating cash to total debt ratio of 11.54%, meaning that EIG’s debt is not appropriately covered by operating cash. This ratio can also be interpreted as a measure of efficiency as an alternative to return on assets. In EIG’s case, it is able to generate 0.12x cash from its debt capital.
Can EIG meet its short-term obligations with the cash in hand?
Looking at EIG’s most recent UK£283.00m liabilities, it appears that the company is not able to meet these obligations given the level of current assets of UK£231.00m, with a current ratio of 0.82x below the prudent level of 3x.
Can EIG service its debt comfortably?
EIG is a highly-leveraged company with debt exceeding equity by over 100%. This is not unusual for small-caps as debt tends to be a cheaper and faster source of funding for some businesses. No matter how high the company’s debt, if it can easily cover the interest payments, it’s considered to be efficient with its use of excess leverage. A company generating earnings after interest and tax at least three times its net interest payments is considered financially sound. In EIG’s case, the ratio of 1.84x suggests that interest is not strongly covered, which means that debtors may be less inclined to loan the company more money, reducing its headroom for growth through debt.
Next Steps:
EIG’s high debt levels is not met with high cash flow coverage. This leaves room for improvement in terms of debt management and operational efficiency. In addition to this, its low liquidity raises concerns over whether current asset management practices are properly implemented for the small-cap. I admit this is a fairly basic analysis for EIG’s financial health. Other important fundamentals need to be considered alongside. You should continue to research Ei Group to get a better picture of the stock by looking at:
Future Outlook: What are well-informed industry analysts predicting for EIG’s future growth? Take a look at our free research report of analyst consensus for EIG’s outlook.
Valuation: What is EIG worth today? Is the stock undervalued, even when its growth outlook is factored into its intrinsic value? The intrinsic value infographic in our free research report helps visualize whether EIG is currently mispriced by the market.
Other High-Performing Stocks: Are there other stocks that provide better prospects with proven track records? Explore our free list of these great stocks here.
To help readers see pass the short term volatility of the financial market, we aim to bring you a long-term focused research analysis purely driven by fundamental data. Note that our analysis does not factor in the latest price sensitive company announcements.
The author is an independent contributor and at the time of publication had no position in the stocks mentioned.
