
 Yahoo Finance
 Ekovest Berhad (KLSE:EKOVEST) Is Finding It Tricky To Allocate Its Capital
When we're researching a company, it's sometimes hard to find the warning signs, but there are some financial metrics that can help spot trouble early. When we see a declining return on capital employed (ROCE) in conjunction with a declining base of capital employed, that's often how a mature business shows signs of aging. This reveals that the company isn't compounding shareholder wealth because returns are falling and its net asset base is shrinking. So after glancing at the trends within Ekovest Berhad (KLSE:EKOVEST), we weren't too hopeful.
What Is Return On Capital Employed (ROCE)?
If you haven't worked with ROCE before, it measures the 'return' (pre-tax profit) a company generates from capital employed in its business. To calculate this metric for Ekovest Berhad, this is the formula:
Return on Capital Employed = Earnings Before Interest and Tax (EBIT) ÷ (Total Assets - Current Liabilities)
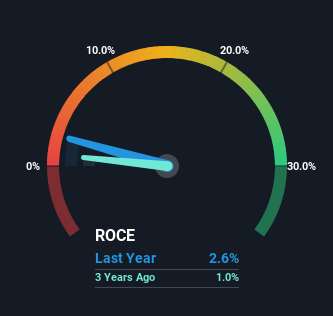
0.026 = RM263m ÷ (RM11b - RM1.4b) (Based on the trailing twelve months to September 2023).
Therefore, Ekovest Berhad has an ROCE of 2.6%. Ultimately, that's a low return and it under-performs the Construction industry average of 6.3%.
View our latest analysis for Ekovest Berhad
In the above chart we have measured Ekovest Berhad's prior ROCE against its prior performance, but the future is arguably more important. If you'd like to see what analysts are forecasting going forward, you should check out our free report for Ekovest Berhad.
So How Is Ekovest Berhad's ROCE Trending?
There is reason to be cautious about Ekovest Berhad, given the returns are trending downwards. About five years ago, returns on capital were 3.7%, however they're now substantially lower than that as we saw above. Meanwhile, capital employed in the business has stayed roughly the flat over the period. Since returns are falling and the business has the same amount of assets employed, this can suggest it's a mature business that hasn't had much growth in the last five years. If these trends continue, we wouldn't expect Ekovest Berhad to turn into a multi-bagger.
In Conclusion...
All in all, the lower returns from the same amount of capital employed aren't exactly signs of a compounding machine. Despite the concerning underlying trends, the stock has actually gained 9.1% over the last five years, so it might be that the investors are expecting the trends to reverse. Regardless, we don't like the trends as they are and if they persist, we think you might find better investments elsewhere.
One more thing: We've identified 2 warning signs with Ekovest Berhad (at least 1 which is a bit unpleasant) , and understanding them would certainly be useful.
While Ekovest Berhad may not currently earn the highest returns, we've compiled a list of companies that currently earn more than 25% return on equity. Check out this free list here.
Have feedback on this article? Concerned about the content? Get in touch with us directly. Alternatively, email editorial-team (at) simplywallst.com.
This article by Simply Wall St is general in nature. We provide commentary based on historical data and analyst forecasts only using an unbiased methodology and our articles are not intended to be financial advice. It does not constitute a recommendation to buy or sell any stock, and does not take account of your objectives, or your financial situation. We aim to bring you long-term focused analysis driven by fundamental data. Note that our analysis may not factor in the latest price-sensitive company announcements or qualitative material. Simply Wall St has no position in any stocks mentioned.
