
 Yahoo Finance
 Elementis (LON:ELM) Share Prices Have Dropped 72% In The Last Three Years

Investing in stocks inevitably means buying into some companies that perform poorly. But the last three years have been particularly tough on longer term Elementis plc (LON:ELM) shareholders. Sadly for them, the share price is down 72% in that time. The more recent news is of little comfort, with the share price down 55% in a year.
View our latest analysis for Elementis
In his essay The Superinvestors of Graham-and-Doddsville Warren Buffett described how share prices do not always rationally reflect the value of a business. One imperfect but simple way to consider how the market perception of a company has shifted is to compare the change in the earnings per share (EPS) with the share price movement.
Elementis saw its share price decline over the three years in which its EPS also dropped, falling to a loss. Due to the loss, it's not easy to use EPS as a reliable guide to the business. However, we can say we'd expect to see a falling share price in this scenario.
You can see how EPS has changed over time in the image below (click on the chart to see the exact values).
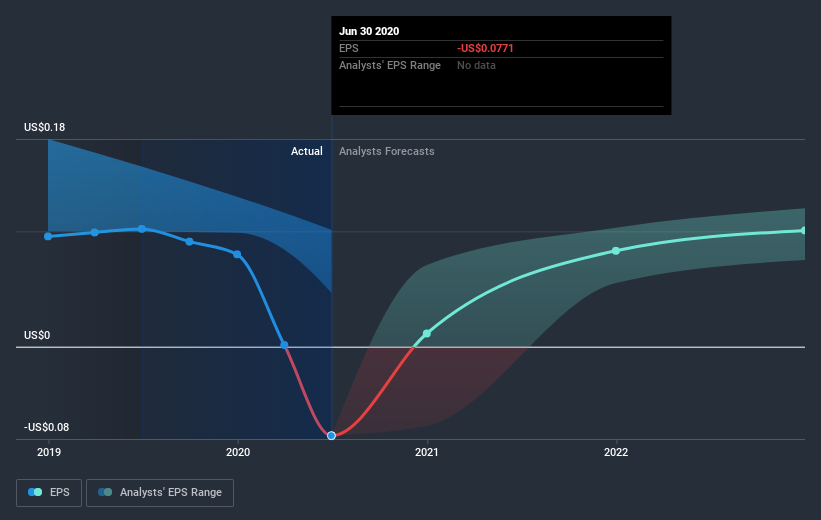
We consider it positive that insiders have made significant purchases in the last year. Having said that, most people consider earnings and revenue growth trends to be a more meaningful guide to the business. Dive deeper into the earnings by checking this interactive graph of Elementis' earnings, revenue and cash flow.
What about the Total Shareholder Return (TSR)?
Investors should note that there's a difference between Elementis' total shareholder return (TSR) and its share price change, which we've covered above. The TSR attempts to capture the value of dividends (as if they were reinvested) as well as any spin-offs or discounted capital raisings offered to shareholders. Dividends have been really beneficial for Elementis shareholders, and that cash payout explains why its total shareholder loss of 68%, over the last 3 years, isn't as bad as the share price return.
A Different Perspective
We regret to report that Elementis shareholders are down 55% for the year. Unfortunately, that's worse than the broader market decline of 10%. However, it could simply be that the share price has been impacted by broader market jitters. It might be worth keeping an eye on the fundamentals, in case there's a good opportunity. Unfortunately, last year's performance may indicate unresolved challenges, given that it was worse than the annualised loss of 9.3% over the last half decade. Generally speaking long term share price weakness can be a bad sign, though contrarian investors might want to research the stock in hope of a turnaround. It's always interesting to track share price performance over the longer term. But to understand Elementis better, we need to consider many other factors. For instance, we've identified 1 warning sign for Elementis that you should be aware of.
Elementis is not the only stock that insiders are buying. For those who like to find winning investments this free list of growing companies with recent insider purchasing, could be just the ticket.
Please note, the market returns quoted in this article reflect the market weighted average returns of stocks that currently trade on GB exchanges.
This article by Simply Wall St is general in nature. It does not constitute a recommendation to buy or sell any stock, and does not take account of your objectives, or your financial situation. We aim to bring you long-term focused analysis driven by fundamental data. Note that our analysis may not factor in the latest price-sensitive company announcements or qualitative material. Simply Wall St has no position in any stocks mentioned.
Have feedback on this article? Concerned about the content? Get in touch with us directly. Alternatively, email editorial-team@simplywallst.com.
