
 Yahoo Finance
 Some ElringKlinger (FRA:ZIL2) Shareholders Have Taken A Painful 77% Share Price Drop

Long term investing is the way to go, but that doesn’t mean you should hold every stock forever. We don’t wish catastrophic capital loss on anyone. Spare a thought for those who held ElringKlinger AG (FRA:ZIL2) for five whole years – as the share price tanked 77%. And we doubt long term believers are the only worried holders, since the stock price has declined 63% over the last twelve months. Shareholders have had an even rougher run lately, with the share price down 21% in the last 90 days.
See our latest analysis for ElringKlinger
While markets are a powerful pricing mechanism, share prices reflect investor sentiment, not just underlying business performance. One way to examine how market sentiment has changed over time is to look at the interaction between a company’s share price and its earnings per share (EPS).
During the five years over which the share price declined, ElringKlinger’s earnings per share (EPS) dropped by 8.3% each year. This reduction in EPS is less than the 26% annual reduction in the share price. This implies that the market was previously too optimistic about the stock. The low P/E ratio of 6.80 further reflects this reticence.
The image below shows how EPS has tracked over time (if you click on the image you can see greater detail).
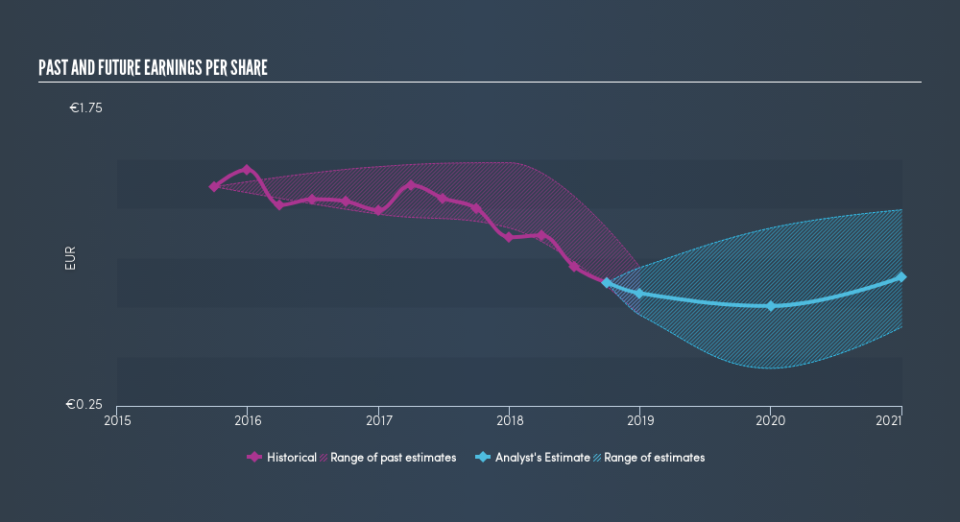
It might be well worthwhile taking a look at our free report on ElringKlinger’s earnings, revenue and cash flow.
What About Dividends?
It is important to consider the total shareholder return, as well as the share price return, for any given stock. Whereas the share price return only reflects the change in the share price, the TSR includes the value of dividends (assuming they were reinvested) and the benefit of any discounted capital raising. Arguably, the TSR gives a more comprehensive picture of the return generated by a stock. As it happens, ElringKlinger’s TSR for the last 5 years was -74%, which exceeds the share price return mentioned earlier. And there’s no prize for guessing that the dividend payments largely explain the divergence!
A Different Perspective
We regret to report that ElringKlinger shareholders are down 62% for the year (even including dividends). Unfortunately, that’s worse than the broader market decline of 8.0%. Having said that, it’s inevitable that some stocks will be oversold in a falling market. The key is to keep your eyes on the fundamental developments. Unfortunately, last year’s performance may indicate unresolved challenges, given that it was worse than the annualised loss of 24% over the last half decade. Generally speaking long term share price weakness can be a bad sign, though contrarian investors might want to research the stock in hope of a turnaround. Before forming an opinion on ElringKlinger you might want to consider the cold hard cash it pays as a dividend. This free chart tracks its dividend over time.
Of course, you might find a fantastic investment by looking elsewhere. So take a peek at this free list of companies we expect will grow earnings.
Please note, the market returns quoted in this article reflect the market weighted average returns of stocks that currently trade on DE exchanges.
We aim to bring you long-term focused research analysis driven by fundamental data. Note that our analysis may not factor in the latest price-sensitive company announcements or qualitative material.
If you spot an error that warrants correction, please contact the editor at editorial-team@simplywallst.com. This article by Simply Wall St is general in nature. It does not constitute a recommendation to buy or sell any stock, and does not take account of your objectives, or your financial situation. Simply Wall St has no position in the stocks mentioned. Thank you for reading.
